orchestrata_ultimate.orchestrator.intent_metrics
Reference › orchestrata_ultimate › orchestrator › intent_metrics
The monitoring layer for intent processing: counters, gauges and latency histograms, kept in memory and optionally persisted to Redis. intent_broker takes an IntentMetricsCollector as an optional collaborator. The module depends on nothing internal but the traceability decorator.
The data model is MetricType (counter, gauge, histogram), Metric, MetricValue, HistogramBucket and IntentMetricEvent. The collector's constructor takes an optional async Redis client, a retention period (30 days) and a key prefix (intent_metrics). _init_metrics registers intents_total, intents_failed_total, the gauge intents_in_progress, and histograms for total, parsing, validation and routing latency in milliseconds. record_intent_processed labels a counter and the histograms by action, target, requester and status, adds the failure counter with an error type when the status is failed, keeps the event in a buffer of the last 10,000 events, persists it, and checks alerts. Queries include get_metrics_summary, get_metrics_by_dimension over a time window, get_aggregated_metrics, and percentile helpers. export_prometheus_format and export_json produce output for scraping. set_alert_threshold registers a callback, get_active_alerts and clear_alerts manage fired alerts, and cleanup_old_metrics applies retention. MetricsMiddleware.wrap_intent_processing times a processing call and records the result.
At a glance
| Source | src/orchestrata_ultimate/orchestrator/intent_metrics.py |
| Lines of code | 673 |
| Classes | 7 |
| Functions | 0 |
| Imports (internal) | orchestrata_ultimate.core.base.traces |
| Imported by | orchestrata_ultimate.orchestrator.intent_broker |
| Tests that import it | tests/generated_orchestrator/test_intent_metrics_generated.py, tests/orchestrator/test_intent_metrics_behavioral.py, tests/orchestrator/test_intent_metrics_extended.py |
Class diagram
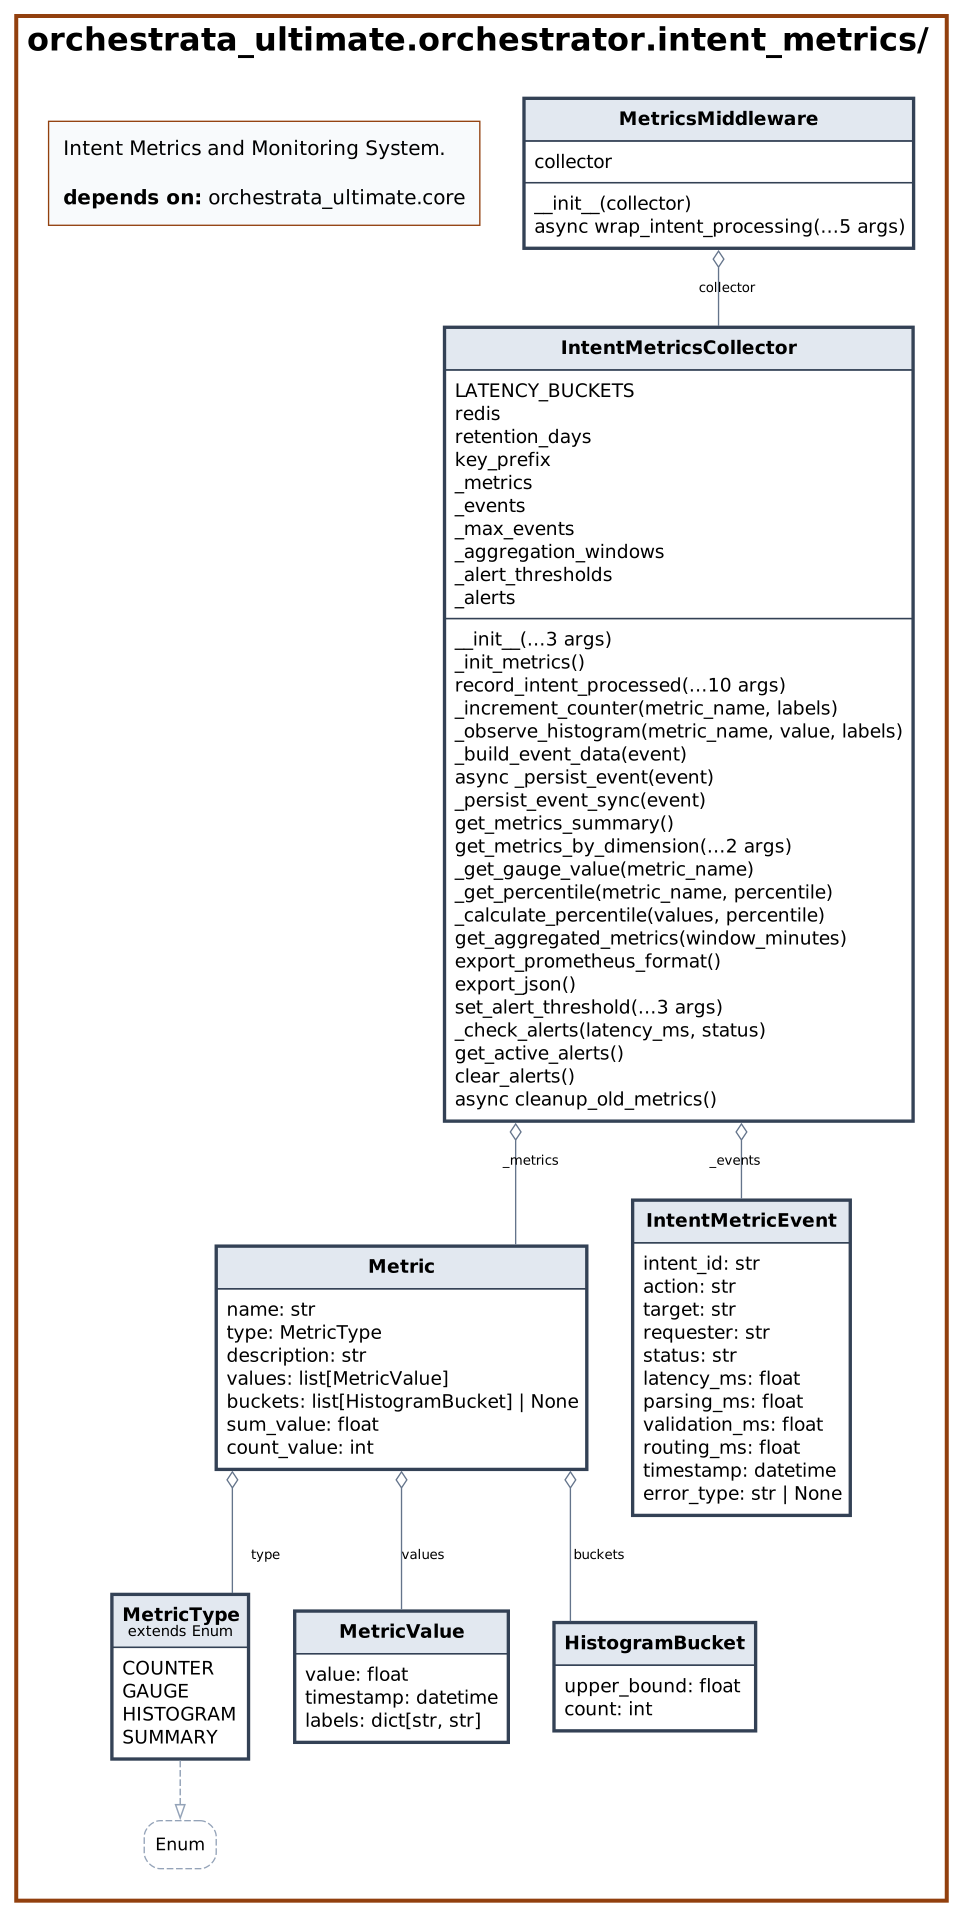
Dependency diagram

API
Classes
MetricType (enum)
Bases: Enum · Decorators: traces(spec='003', story='US-009', reqs=['REQ-003-US-009-014']) · Line 33
Type of metric.
| Member | Value |
|---|---|
COUNTER |
'counter' |
GAUGE |
'gauge' |
HISTOGRAM |
'histogram' |
SUMMARY |
'summary' |
MetricValue (dataclass)
Decorators: traces(spec='003', story='US-009', reqs=['REQ-003-US-009-014']), dataclass · Line 44
A single metric value with timestamp.
| Attribute | Type | Default |
|---|---|---|
value |
float |
|
timestamp |
datetime |
field(default_factory=datetime.now) |
labels |
dict[str, str] |
field(default_factory=dict) |
HistogramBucket (dataclass)
Decorators: traces(spec='003', story='US-009', reqs=['REQ-003-US-009-014']), dataclass · Line 54
Histogram bucket for latency distribution.
| Attribute | Type | Default |
|---|---|---|
upper_bound |
float |
|
count |
int |
0 |
Metric (dataclass)
Decorators: traces(spec='003', story='US-009', reqs=['REQ-003-US-009-014']), dataclass · Line 63
Metric definition and values.
| Attribute | Type | Default |
|---|---|---|
name |
str |
|
type |
MetricType |
|
description |
str |
|
values |
list[MetricValue] |
field(default_factory=list) |
buckets |
list[HistogramBucket] | None |
None |
sum_value |
float |
0.0 |
count_value |
int |
0 |
IntentMetricEvent (dataclass)
Decorators: traces(spec='003', story='US-009', reqs=['REQ-003-US-009-012']), dataclass · Line 77
Metric event for an intent processing.
| Attribute | Type | Default |
|---|---|---|
intent_id |
str |
|
action |
str |
|
target |
str |
|
requester |
str |
|
status |
str |
|
latency_ms |
float |
|
parsing_ms |
float |
0.0 |
validation_ms |
float |
0.0 |
routing_ms |
float |
0.0 |
timestamp |
datetime |
field(default_factory=datetime.now) |
error_type |
str | None |
None |
IntentMetricsCollector
Decorators: traces(spec='003', story='US-009', reqs=['REQ-003-US-009-011']) · Line 94
Collector for intent processing metrics.
| Method | Signature | Summary |
|---|---|---|
__init__ |
__init__(redis_client: redis.asyncio.Redis | None = None, retention_days: int = 30, key_prefix: str = 'intent_metrics') |
Initialize the metrics collector. |
_init_metrics |
_init_metrics() -> None |
Initialize all metrics. |
record_intent_processed |
record_intent_processed(intent_id: str, action: str, target: str, requester: str, status: str, latency_ms: float, parsing_ms: float = 0.0, validation_ms: float = 0.0, routing_ms: float = 0.0, error_type: str | None = None) -> None |
Record metrics for a processed intent. |
_increment_counter |
_increment_counter(metric_name: str, labels: dict[str, str]) -> None |
Increment a counter metric. |
_observe_histogram |
_observe_histogram(metric_name: str, value: float, labels: dict[str, str]) -> None |
Observe a value in a histogram. |
_build_event_data |
_build_event_data(event: IntentMetricEvent) -> dict |
Build serializable dict from event. |
_persist_event |
async _persist_event(event: IntentMetricEvent) -> None |
Persist event to Redis asynchronously. |
_persist_event_sync |
_persist_event_sync(event: IntentMetricEvent) -> None |
Persist event to Redis synchronously. |
get_metrics_summary |
get_metrics_summary() -> dict[str, Any] |
Get summary of all metrics. |
get_metrics_by_dimension |
get_metrics_by_dimension(dimension: str, time_window_minutes: int = 60) -> dict[str, dict[str, Any]] |
Get metrics broken down by dimension. |
_get_gauge_value |
_get_gauge_value(metric_name: str) -> float |
Get current gauge value. |
_get_percentile |
_get_percentile(metric_name: str, percentile: float) -> float |
Get percentile value for a histogram metric. |
_calculate_percentile |
_calculate_percentile(values: list[float], percentile: float) -> float |
Calculate percentile from values using linear interpolation. |
get_aggregated_metrics |
get_aggregated_metrics(window_minutes: int = 5) -> list[dict[str, Any]] |
Get time-windowed aggregated metrics. |
export_prometheus_format |
export_prometheus_format() -> str |
Export metrics in Prometheus exposition format. |
export_json |
export_json() -> dict[str, Any] |
Export metrics as JSON. |
set_alert_threshold |
set_alert_threshold(metric_name: str, threshold: float, callback: Callable[[str, float], None]) -> None |
Set alert threshold for a metric. |
_check_alerts |
_check_alerts(latency_ms: float, status: str) -> None |
Check if any alert thresholds are breached. |
get_active_alerts |
get_active_alerts() -> list[dict[str, Any]] |
Get list of active alerts. |
clear_alerts |
clear_alerts() -> None |
Clear all alerts. |
cleanup_old_metrics |
async cleanup_old_metrics() -> None |
Clean up metrics older than retention period. |
MetricsMiddleware
Decorators: traces(spec='003', story='US-009', reqs=['REQ-003-US-009-012']) · Line 599
Middleware for automatic metrics collection.
| Method | Signature | Summary |
|---|---|---|
__init__ |
__init__(collector: IntentMetricsCollector) |
Initialize middleware. |
wrap_intent_processing |
async wrap_intent_processing(intent_id: str, action: str, target: str, requester: str, process_func: Callable, **args, ****kwargs) -> Any |
Wrap intent processing with metrics collection. |
Source
# mypy: ignore-errors
"""Intent Metrics and Monitoring System.
This module provides comprehensive metrics collection, aggregation, and export
for the Intent Broker system with Prometheus and Grafana integration.
@traces(spec="003", story="US-009", reqs=["REQ-003-US-009-001", "REQ-003-US-009-003", "REQ-003-US-009-004", "REQ-003-US-009-005", "REQ-003-US-009-006", "REQ-003-US-009-010", "REQ-003-US-009-013", "REQ-003-US-009-015", "REQ-003-US-009-017", "REQ-003-US-009-020", "REQ-003-US-009-022", "REQ-003-US-009-025", "REQ-003-US-009-026", "REQ-003-US-009-027", "REQ-003-US-009-028", "REQ-003-US-009-029", "REQ-003-US-009-030", "REQ-003-US-009-031", "REQ-003-US-009-032", "REQ-003-US-009-033", "REQ-003-US-009-035"])
"""
from __future__ import annotations
import asyncio
import inspect
import json
import logging
import time
from collections import defaultdict
from collections.abc import Callable
from dataclasses import dataclass, field
from datetime import datetime, timedelta
from enum import Enum
from typing import TYPE_CHECKING, Any
from orchestrata_ultimate.core.base.traces import traces
if TYPE_CHECKING:
import redis.asyncio
_logger = logging.getLogger(__name__)
@traces(spec="003", story="US-009", reqs=["REQ-003-US-009-014"])
class MetricType(Enum):
"""Type of metric."""
COUNTER = "counter"
GAUGE = "gauge"
HISTOGRAM = "histogram"
SUMMARY = "summary"
@traces(spec="003", story="US-009", reqs=["REQ-003-US-009-014"])
@dataclass
class MetricValue:
"""A single metric value with timestamp."""
value: float
timestamp: datetime = field(default_factory=datetime.now)
labels: dict[str, str] = field(default_factory=dict)
@traces(spec="003", story="US-009", reqs=["REQ-003-US-009-014"])
@dataclass
class HistogramBucket:
"""Histogram bucket for latency distribution."""
upper_bound: float
count: int = 0
@traces(spec="003", story="US-009", reqs=["REQ-003-US-009-014"])
@dataclass
class Metric:
"""Metric definition and values."""
name: str
type: MetricType
description: str
values: list[MetricValue] = field(default_factory=list)
buckets: list[HistogramBucket] | None = None # For histograms
sum_value: float = 0.0 # For histograms/summaries
count_value: int = 0 # For histograms/summaries
@traces(spec="003", story="US-009", reqs=["REQ-003-US-009-012"])
@dataclass
class IntentMetricEvent:
"""Metric event for an intent processing."""
intent_id: str
action: str
target: str
requester: str
status: str
latency_ms: float
parsing_ms: float = 0.0
validation_ms: float = 0.0
routing_ms: float = 0.0
timestamp: datetime = field(default_factory=datetime.now)
error_type: str | None = None
@traces(spec="003", story="US-009", reqs=["REQ-003-US-009-011"])
class IntentMetricsCollector:
"""Collector for intent processing metrics.
@traces(spec="003", story="US-009", reqs=["REQ-003-US-009-011"])
"""
# Latency buckets in milliseconds
LATENCY_BUCKETS = [1, 5, 10, 25, 50, 100, 250, 500, 1000, 2500, 5000, 10000]
def __init__(
self,
redis_client: redis.asyncio.Redis | None = None,
retention_days: int = 30,
key_prefix: str = "intent_metrics",
):
"""Initialize the metrics collector.
Args:
redis_client: Optional Redis client for persistence
retention_days: Number of days to retain metrics
key_prefix: Redis key prefix for isolation
"""
self.redis = redis_client
self.retention_days = retention_days
self.key_prefix = key_prefix
# Initialize metrics
self._metrics: dict[str, Metric] = {}
self._init_metrics()
# In-memory event buffer (last 10000 events)
self._events: list[IntentMetricEvent] = []
self._max_events = 10000
# Aggregation windows
self._aggregation_windows: dict[str, list[tuple[datetime, dict]]] = defaultdict(
list
)
# Alert thresholds
self._alert_thresholds: dict[str, tuple[float, Callable]] = {}
self._alerts: list[dict[str, Any]] = []
@traces(spec="003", story="US-009", reqs=["REQ-003-US-009-014"])
def _init_metrics(self) -> None:
"""Initialize all metrics."""
# Counter metrics
self._metrics["intents_total"] = Metric(
name="intents_total",
type=MetricType.COUNTER,
description="Total number of intents processed",
)
self._metrics["intents_failed_total"] = Metric(
name="intents_failed_total",
type=MetricType.COUNTER,
description="Total number of failed intents",
)
# Gauge metrics
self._metrics["intents_in_progress"] = Metric(
name="intents_in_progress",
type=MetricType.GAUGE,
description="Number of intents currently being processed",
)
# Histogram metrics
self._metrics["intent_latency_ms"] = Metric(
name="intent_latency_ms",
type=MetricType.HISTOGRAM,
description="Intent processing latency in milliseconds",
buckets=[HistogramBucket(b) for b in self.LATENCY_BUCKETS],
)
self._metrics["intent_parsing_ms"] = Metric(
name="intent_parsing_ms",
type=MetricType.HISTOGRAM,
description="Intent parsing latency in milliseconds",
buckets=[HistogramBucket(b) for b in self.LATENCY_BUCKETS],
)
self._metrics["intent_validation_ms"] = Metric(
name="intent_validation_ms",
type=MetricType.HISTOGRAM,
description="Intent validation latency in milliseconds",
buckets=[HistogramBucket(b) for b in self.LATENCY_BUCKETS],
)
self._metrics["intent_routing_ms"] = Metric(
name="intent_routing_ms",
type=MetricType.HISTOGRAM,
description="Intent routing latency in milliseconds",
buckets=[HistogramBucket(b) for b in self.LATENCY_BUCKETS],
)
# Cross-story: REQ-003-US-004-009 ("Routing metrics tracked (latency, success
# rate)") is a US-004 (Intent Routing) requirement satisfied here in
# US-009 (Intent Monitoring and Metrics) — the routing story REQUIRES
# metrics, the monitoring module PROVIDES them; a requirement and its
# implementation need not share a story number. routing_ms below is
# routing latency, and intents_total/intents_failed_total (via
# _increment_counter) make a success rate computable — see
# specs/003-intent/spec.md:92 (US-004) and :178 (US-009), and
# specs/003-intent/checklists/requirements.md:319 for the requirement
# text. Do not re-litigate this without re-reading both story sections.
@traces(
spec="003",
story="US-009",
reqs=["REQ-003-US-004-009", "REQ-003-US-009-001", "REQ-003-US-009-002"],
)
def record_intent_processed(
self,
intent_id: str,
action: str,
target: str,
requester: str,
status: str,
latency_ms: float,
parsing_ms: float = 0.0,
validation_ms: float = 0.0,
routing_ms: float = 0.0,
error_type: str | None = None,
) -> None:
"""Record metrics for a processed intent.
@traces(spec="003", story="US-009", reqs=["REQ-003-US-004-009", "REQ-003-US-009-001", "REQ-003-US-009-002"])
"""
labels = {
"action": action,
"target": target,
"requester": requester,
"status": status,
}
# Record counter
self._increment_counter("intents_total", labels)
if status == "failed":
fail_labels = {**labels, "error_type": error_type or "unknown"}
self._increment_counter("intents_failed_total", fail_labels)
# Record histograms
self._observe_histogram("intent_latency_ms", latency_ms, labels)
self._observe_histogram("intent_parsing_ms", parsing_ms, labels)
self._observe_histogram("intent_validation_ms", validation_ms, labels)
self._observe_histogram("intent_routing_ms", routing_ms, labels)
# Store event
event = IntentMetricEvent(
intent_id=intent_id,
action=action,
target=target,
requester=requester,
status=status,
latency_ms=latency_ms,
parsing_ms=parsing_ms,
validation_ms=validation_ms,
routing_ms=routing_ms,
error_type=error_type,
)
self._events.append(event)
# Trim events if needed
if len(self._events) > self._max_events:
self._events = self._events[-self._max_events :]
# Persist to Redis if available
if self.redis:
coro = self._persist_event(event)
try:
asyncio.create_task(coro)
except RuntimeError:
# No event loop — close the unawaited coroutine, persist synchronously
coro.close()
self._persist_event_sync(event)
# Check alerts
self._check_alerts(latency_ms, status)
@traces(spec="003", story="US-009", reqs=["REQ-003-US-009-012"])
def _increment_counter(self, metric_name: str, labels: dict[str, str]) -> None:
"""Increment a counter metric."""
metric = self._metrics[metric_name]
metric.values.append(MetricValue(value=1, labels=labels))
metric.count_value += 1
@traces(spec="003", story="US-009", reqs=["REQ-003-US-009-012"])
def _observe_histogram(
self, metric_name: str, value: float, labels: dict[str, str]
) -> None:
"""Observe a value in a histogram."""
metric = self._metrics[metric_name]
metric.values.append(MetricValue(value=value, labels=labels))
metric.sum_value += value
metric.count_value += 1
# Update buckets
if metric.buckets:
for bucket in metric.buckets:
if value <= bucket.upper_bound:
bucket.count += 1
@traces(spec="003", story="US-009", reqs=["REQ-003-US-009-014"])
def _build_event_data(self, event: IntentMetricEvent) -> dict:
"""Build serializable dict from event."""
return {
"intent_id": event.intent_id,
"action": event.action,
"target": event.target,
"requester": event.requester,
"status": event.status,
"latency_ms": event.latency_ms,
"parsing_ms": event.parsing_ms,
"validation_ms": event.validation_ms,
"routing_ms": event.routing_ms,
"timestamp": event.timestamp.isoformat(),
"error_type": event.error_type or "",
}
@traces(spec="003", story="US-009", reqs=["REQ-003-US-009-014"])
async def _persist_event(self, event: IntentMetricEvent) -> None:
"""Persist event to Redis asynchronously."""
if not self.redis:
return
key = f"{self.key_prefix}:events:{event.timestamp.strftime('%Y-%m-%d')}"
data = self._build_event_data(event)
result = self.redis.lpush(key, json.dumps(data))
if inspect.isawaitable(result):
await result
result = self.redis.expire(key, 86400 * self.retention_days)
if inspect.isawaitable(result):
await result
@traces(spec="003", story="US-009", reqs=["REQ-003-US-009-014"])
def _persist_event_sync(self, event: IntentMetricEvent) -> None:
"""Persist event to Redis synchronously."""
if not self.redis:
return
key = f"{self.key_prefix}:events:{event.timestamp.strftime('%Y-%m-%d')}"
data = self._build_event_data(event)
try:
self.redis.lpush(key, json.dumps(data))
self.redis.expire(key, 86400 * self.retention_days)
except Exception as exc:
_logger.warning("Redis metrics push failed: %s", exc)
@traces(spec="003", story="US-009", reqs=["REQ-003-US-009-009"])
def get_metrics_summary(self) -> dict[str, Any]:
"""Get summary of all metrics.
@traces(spec="003", story="US-009", reqs=["REQ-003-US-009-009"])
"""
return {
"intents_total": self._metrics["intents_total"].count_value,
"intents_failed_total": self._metrics["intents_failed_total"].count_value,
"intents_in_progress": self._get_gauge_value("intents_in_progress"),
"latency_p50": self._get_percentile("intent_latency_ms", 50),
"latency_p95": self._get_percentile("intent_latency_ms", 95),
"latency_p99": self._get_percentile("intent_latency_ms", 99),
"parsing_p95": self._get_percentile("intent_parsing_ms", 95),
"validation_p95": self._get_percentile("intent_validation_ms", 95),
"routing_p95": self._get_percentile("intent_routing_ms", 95),
}
@traces(spec="003", story="US-009", reqs=["REQ-003-US-009-002"])
def get_metrics_by_dimension(
self, dimension: str, time_window_minutes: int = 60
) -> dict[str, dict[str, Any]]:
"""Get metrics broken down by dimension.
@traces(spec="003", story="US-009", reqs=["REQ-003-US-009-002"])
"""
cutoff = datetime.now() - timedelta(minutes=time_window_minutes)
# Group events by dimension
grouped = defaultdict(list)
for event in self._events:
if event.timestamp >= cutoff:
key = getattr(event, dimension, "unknown")
grouped[key].append(event)
result = {}
for key, events in grouped.items():
latencies = [e.latency_ms for e in events]
failures = [e for e in events if e.status == "failed"]
result[key] = {
"count": len(events),
"failure_count": len(failures),
"failure_rate": len(failures) / len(events) if events else 0,
"latency_p50": self._calculate_percentile(latencies, 50),
"latency_p95": self._calculate_percentile(latencies, 95),
"latency_p99": self._calculate_percentile(latencies, 99),
}
return result
@traces(spec="003", story="US-009", reqs=["REQ-003-US-009-009"])
def _get_gauge_value(self, metric_name: str) -> float:
"""Get current gauge value."""
metric = self._metrics[metric_name]
if metric.values:
return metric.values[-1].value
return 0.0
@traces(spec="003", story="US-009", reqs=["REQ-003-US-009-009"])
def _get_percentile(self, metric_name: str, percentile: float) -> float:
"""Get percentile value for a histogram metric."""
metric = self._metrics[metric_name]
values = [v.value for v in metric.values]
return self._calculate_percentile(values, percentile)
@traces(spec="003", story="US-009", reqs=["REQ-003-US-009-001"])
def _calculate_percentile(self, values: list[float], percentile: float) -> float:
"""Calculate percentile from values using linear interpolation."""
if not values:
return 0.0
sorted_values = sorted(values)
n = len(sorted_values)
if n == 1:
return sorted_values[0]
rank = (percentile / 100) * (n - 1)
lower = int(rank)
upper = min(lower + 1, n - 1)
frac = rank - lower
return sorted_values[lower] + frac * (
sorted_values[upper] - sorted_values[lower]
)
@traces(spec="003", story="US-009", reqs=["REQ-003-US-009-007"])
def get_aggregated_metrics(self, window_minutes: int = 5) -> list[dict[str, Any]]:
"""Get time-windowed aggregated metrics.
@traces(spec="003", story="US-009", reqs=["REQ-003-US-009-007"])
"""
if not self._events:
return []
# Group events into time windows
windows = defaultdict(list)
for event in self._events:
window_key = event.timestamp.replace(
minute=(event.timestamp.minute // window_minutes) * window_minutes,
second=0,
microsecond=0,
)
windows[window_key].append(event)
result = []
for window_time, events in sorted(windows.items()):
latencies = [e.latency_ms for e in events]
failures = [e for e in events if e.status == "failed"]
result.append(
{
"window_start": window_time.isoformat(),
"window_end": (
window_time + timedelta(minutes=window_minutes)
).isoformat(),
"intent_count": len(events),
"failure_count": len(failures),
"failure_rate": len(failures) / len(events) if events else 0,
"latency_avg": sum(latencies) / len(latencies) if latencies else 0,
"latency_p50": self._calculate_percentile(latencies, 50),
"latency_p95": self._calculate_percentile(latencies, 95),
}
)
return result
@traces(spec="003", story="US-009", reqs=["REQ-003-US-009-016"])
def export_prometheus_format(self) -> str:
"""Export metrics in Prometheus exposition format.
@traces(spec="003", story="US-009", reqs=["REQ-003-US-009-016"])
"""
lines = []
for metric_name, metric in self._metrics.items():
lines.append(f"# HELP {metric_name} {metric.description}")
lines.append(f"# TYPE {metric_name} {metric.type.value}")
if metric.type == MetricType.HISTOGRAM:
# Export histogram buckets. `buckets` is a general Optional
# field on Metric (only histograms populate it in
# _init_metrics), so guard defensively rather than assume.
cumulative_count = 0
for bucket in metric.buckets or []:
cumulative_count += bucket.count
lines.append(
f'{metric_name}_bucket{{le="{bucket.upper_bound}"}} {cumulative_count}'
)
lines.append(f'{metric_name}_bucket{{le="+Inf"}} {metric.count_value}')
lines.append(f"{metric_name}_sum {metric.sum_value}")
lines.append(f"{metric_name}_count {metric.count_value}")
else:
value = metric.count_value if metric.type == MetricType.COUNTER else 0
lines.append(f"{metric_name} {value}")
lines.append("") # Empty line between metrics
return "\n".join(lines)
@traces(spec="003", story="US-009", reqs=["REQ-003-US-009-023"])
def export_json(self) -> dict[str, Any]:
"""Export metrics as JSON.
@traces(spec="003", story="US-009", reqs=["REQ-003-US-009-023"])
"""
return {
"timestamp": datetime.now().isoformat(),
"summary": self.get_metrics_summary(),
"by_action": self.get_metrics_by_dimension("action"),
"by_target": self.get_metrics_by_dimension("target"),
"by_requester": self.get_metrics_by_dimension("requester"),
"time_series": self.get_aggregated_metrics(),
}
@traces(spec="003", story="US-009", reqs=["REQ-003-US-009-018"])
def set_alert_threshold(
self, metric_name: str, threshold: float, callback: Callable[[str, float], None]
) -> None:
"""Set alert threshold for a metric.
@traces(spec="003", story="US-009", reqs=["REQ-003-US-009-018"])
"""
self._alert_thresholds[metric_name] = (threshold, callback)
@traces(spec="003", story="US-009", reqs=["REQ-003-US-009-018"])
def _check_alerts(self, latency_ms: float, status: str) -> None:
"""Check if any alert thresholds are breached."""
# Check latency threshold
if "intent_latency_ms" in self._alert_thresholds:
threshold, callback = self._alert_thresholds["intent_latency_ms"]
if latency_ms > threshold:
alert = {
"timestamp": datetime.now().isoformat(),
"metric": "intent_latency_ms",
"value": latency_ms,
"threshold": threshold,
"message": f"Intent latency {latency_ms}ms exceeds threshold {threshold}ms",
}
self._alerts.append(alert)
callback("intent_latency_ms", latency_ms)
# Check failure rate
if status == "failed" and "failure_rate" in self._alert_thresholds:
recent_events = [
e
for e in self._events
if e.timestamp > datetime.now() - timedelta(minutes=5)
]
if recent_events:
failure_rate = sum(
1 for e in recent_events if e.status == "failed"
) / len(recent_events)
threshold, callback = self._alert_thresholds["failure_rate"]
if failure_rate > threshold:
alert = {
"timestamp": datetime.now().isoformat(),
"metric": "failure_rate",
"value": failure_rate,
"threshold": threshold,
"message": f"Intent failure rate {failure_rate:.2%} exceeds threshold {threshold:.2%}",
}
self._alerts.append(alert)
callback("failure_rate", failure_rate)
@traces(spec="003", story="US-009", reqs=["REQ-003-US-009-018"])
def get_active_alerts(self) -> list[dict[str, Any]]:
"""Get list of active alerts."""
return self._alerts[-100:] # Return last 100 alerts
@traces(spec="003", story="US-009", reqs=["REQ-003-US-009-018"])
def clear_alerts(self) -> None:
"""Clear all alerts."""
self._alerts.clear()
@traces(spec="003", story="US-009", reqs=["REQ-003-US-009-019"])
async def cleanup_old_metrics(self) -> None:
"""Clean up metrics older than retention period.
@traces(spec="003", story="US-009", reqs=["REQ-003-US-009-019"])
"""
cutoff = datetime.now() - timedelta(days=self.retention_days)
# Clean in-memory events
self._events = [e for e in self._events if e.timestamp >= cutoff]
# Clean metric values
for metric in self._metrics.values():
metric.values = [v for v in metric.values if v.timestamp >= cutoff]
# Clean Redis if available
if self.redis:
# This would iterate through old keys and delete them
pass
@traces(spec="003", story="US-009", reqs=["REQ-003-US-009-012"])
class MetricsMiddleware:
"""Middleware for automatic metrics collection.
@traces(spec="003", story="US-009", reqs=["REQ-003-US-009-012"])
"""
def __init__(self, collector: IntentMetricsCollector):
"""Initialize middleware.
Args:
collector: Metrics collector instance
"""
self.collector = collector
@traces(spec="003", story="US-009", reqs=["REQ-003-US-009-012"])
async def wrap_intent_processing(
self,
intent_id: str,
action: str,
target: str,
requester: str,
process_func: Callable,
*args,
**kwargs,
) -> Any:
"""Wrap intent processing with metrics collection.
@traces(spec="003", story="US-009", reqs=["REQ-003-US-009-012"])
"""
start_time = time.time()
parsing_start = start_time
try:
# Record parsing time (assumed to be before this call)
parsing_end = time.time()
# Execute processing
validation_start = time.time()
result = await process_func(*args, **kwargs)
validation_end = time.time()
routing_start = validation_end
routing_end = time.time()
end_time = time.time()
# Record metrics
self.collector.record_intent_processed(
intent_id=intent_id,
action=action,
target=target,
requester=requester,
status="success",
latency_ms=(end_time - start_time) * 1000,
parsing_ms=(parsing_end - parsing_start) * 1000,
validation_ms=(validation_end - validation_start) * 1000,
routing_ms=(routing_end - routing_start) * 1000,
)
return result
except Exception as e:
end_time = time.time()
# Record failure
self.collector.record_intent_processed(
intent_id=intent_id,
action=action,
target=target,
requester=requester,
status="failed",
latency_ms=(end_time - start_time) * 1000,
error_type=type(e).__name__,
)
raise