orchestrata_ultimate.governance.escalation_handler.sla
Reference › orchestrata_ultimate › governance › escalation_handler › sla
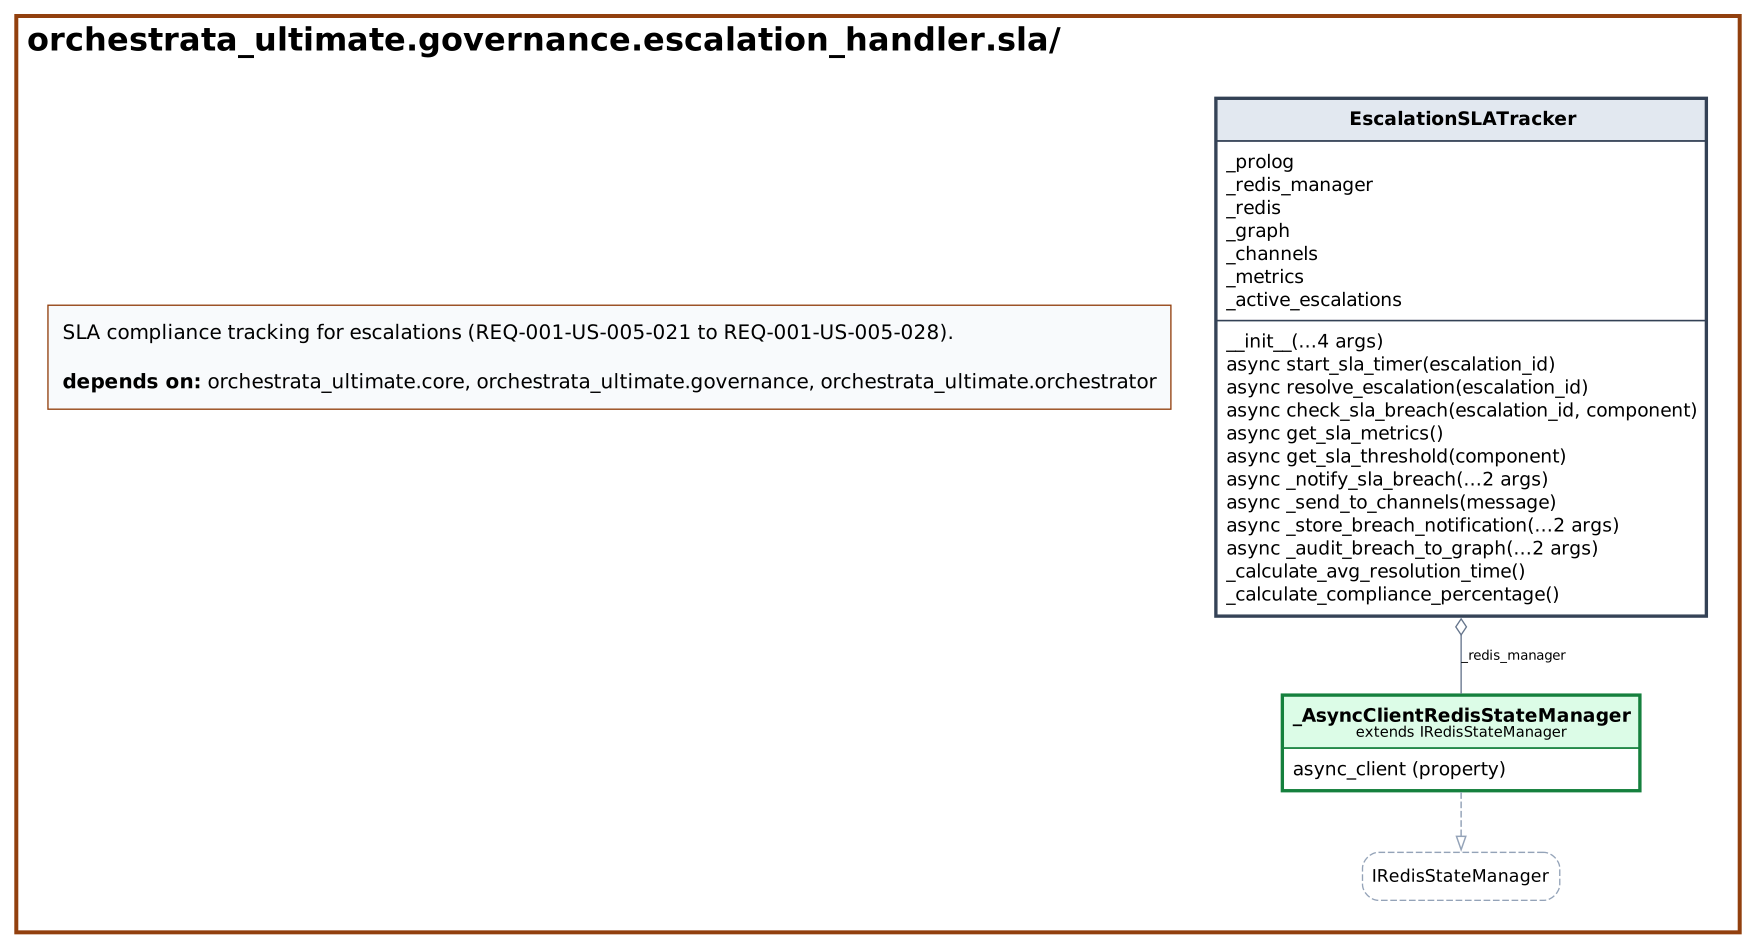
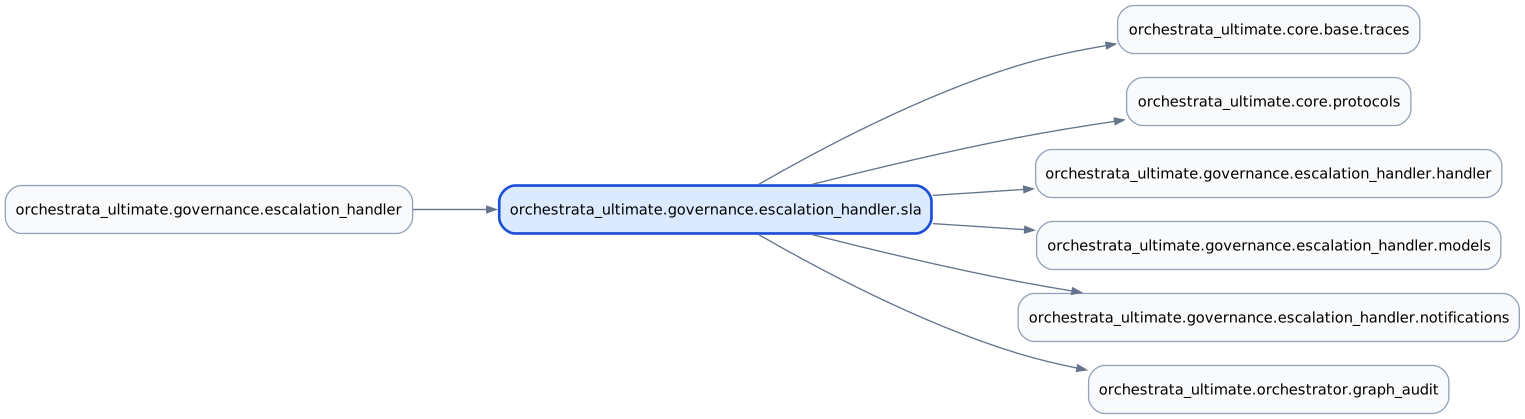
SLA tracking for escalations, SPEC-001 story US-005 (REQ-001-US-005-016, -021 to -028). EscalationSLATracker starts a timer when an escalation begins, checks it against a per-component threshold, and sends a breach notification when the threshold is exceeded. The package initialiser of the escalation_handler subpackage imports it; it uses types from models, the helper functions of handler and the channels from notifications.
The constructor takes a Prolog bridge, a Redis state manager (its async client is used), an optional graph audit trail and a list of notification channels, which defaults to one LogNotificationChannel. start_sla_timer(escalation_id) stores a JSON record with the start time under sla:<id> and sets up in-memory metrics; a Redis failure is logged and re-raised. check_sla_breach(escalation_id, component) reads the record, gets the threshold from get_sla_threshold, and compares it with the elapsed minutes; on a breach it calls _notify_sla_breach and records the result, and an error returns not breached. get_sla_threshold queries pam:sla_threshold/2 and falls back to 30 minutes. _notify_sla_breach sends a message through _send_to_channels, stores the notification in Redis and writes an audit event to the graph. resolve_escalation closes the timer, and get_sla_metrics reports the average resolution time and the compliance percentage.
At a glance
| Source | src/orchestrata_ultimate/governance/escalation_handler/sla.py |
| Lines of code | 339 |
| Classes | 2 |
| Functions | 0 |
| Imports (internal) | orchestrata_ultimate.core.base.traces, orchestrata_ultimate.core.protocols, orchestrata_ultimate.governance.escalation_handler.handler, orchestrata_ultimate.governance.escalation_handler.models, orchestrata_ultimate.governance.escalation_handler.notifications, orchestrata_ultimate.orchestrator.graph_audit |
| Imported by | orchestrata_ultimate.governance.escalation_handler |
| Tests that import it | none |
Class diagram
Dependency diagram
API
Classes
_AsyncClientRedisStateManager (protocol)
Bases: IRedisStateManager, Protocol · Decorators: runtime_checkable · Line 27
IRedisStateManager plus the async_client property this tracker needs.
| Method | Signature | Summary |
|---|---|---|
async_client property |
async_client() -> Any |
EscalationSLATracker
Decorators: traces(spec='001', story='US-005', reqs=['REQ-001-US-005-016', 'REQ-001-US-005-026']) · Line 44
Tracks SLA compliance for escalations (REQ-001-US-005-021 to REQ-001-US-005-028).
| Method | Signature | Summary |
|---|---|---|
__init__ |
__init__(prolog: IGovernancePrologBridge, redis: _AsyncClientRedisStateManager, graph: IAuditTrail | None = None, notification_channels: list[NotificationChannel] | None = None) -> None |
Initialize SLA tracker. |
start_sla_timer |
async start_sla_timer(escalation_id: str) -> None |
Start SLA timer for escalation (REQ-001-US-005-021). |
resolve_escalation |
async resolve_escalation(escalation_id: str) -> None |
Record escalation resolution and compute elapsed time. |
check_sla_breach |
async check_sla_breach(escalation_id: str, component: str = 'default') -> bool |
Check if SLA has been breached (REQ-001-US-005-022, REQ-001-US-005-023). |
get_sla_metrics |
async get_sla_metrics() -> dict[str, Any] |
Get SLA metrics (REQ-001-US-005-024). |
get_sla_threshold |
async get_sla_threshold(component: str) -> int |
Query Prolog for SLA threshold (REQ-001-US-005-025). |
_notify_sla_breach |
async _notify_sla_breach(escalation_id: str, elapsed_minutes: float) -> None |
Notify stakeholders of SLA breach (REQ-001-US-005-026). |
_send_to_channels |
async _send_to_channels(message: str) -> None |
Deliver message to all notification channels. |
_store_breach_notification |
async _store_breach_notification(escalation_id: str, elapsed_minutes: float) -> None |
Store breach notification in Redis. |
_audit_breach_to_graph |
async _audit_breach_to_graph(escalation_id: str, elapsed_minutes: float) -> None |
Log breach event to graph audit trail. |
_calculate_avg_resolution_time |
_calculate_avg_resolution_time() -> float |
Calculate average resolution time from metrics. |
_calculate_compliance_percentage |
_calculate_compliance_percentage() -> float |
Calculate SLA compliance percentage. |
Source
# mypy: ignore-errors
"""SLA compliance tracking for escalations (REQ-001-US-005-021 to REQ-001-US-005-028)."""

import asyncio
import json
import logging
from datetime import datetime
from typing import Any, Protocol, runtime_checkable

from orchestrata_ultimate.core.base.traces import traces
from orchestrata_ultimate.core.protocols import (
    IAuditTrail,
    IGovernancePrologBridge,
    IRedisStateManager,
)
from orchestrata_ultimate.governance.escalation_handler.handler import _quote_atom
from orchestrata_ultimate.governance.escalation_handler.models import _utc_now
from orchestrata_ultimate.governance.escalation_handler.notifications import (
    LogNotificationChannel,
    NotificationChannel,
)

logger = logging.getLogger(__name__)


@runtime_checkable
class _AsyncClientRedisStateManager(IRedisStateManager, Protocol):
    """``IRedisStateManager`` plus the ``async_client`` property this
    tracker needs.

    ``IRedisStateManager`` (``core/protocols/decoupling.py``) is the shared
    cycle-breaking decoupling interface and deliberately doesn't declare
    ``async_client`` (most consumers only need the sync surface). This
    tracker needs the async Redis client (SLA polling is async), so it
    extends the shared Protocol locally rather than widening it
    project-wide (precedent: escalation_handler/resolver.py).
    """

    @property
    def async_client(self) -> Any: ...


@traces(spec="001", story="US-005", reqs=["REQ-001-US-005-016", "REQ-001-US-005-026"])
class EscalationSLATracker:
    """Tracks SLA compliance for escalations (REQ-001-US-005-021 to REQ-001-US-005-028)."""

    def __init__(
        self,
        prolog: IGovernancePrologBridge,
        redis: _AsyncClientRedisStateManager,
        graph: IAuditTrail | None = None,
        notification_channels: list[NotificationChannel] | None = None,
    ) -> None:
        """Initialize SLA tracker.

        Args:
            prolog: Prolog bridge
            redis: Redis state manager
            graph: Optional graph audit logger
            notification_channels: Channels for breach alerts
        """
        self._prolog = prolog
        self._redis_manager = redis
        self._redis = redis.async_client  # Use async Redis client
        self._graph = graph
        self._channels: list[NotificationChannel] = (
            notification_channels
            if notification_channels is not None
            else [LogNotificationChannel()]
        )

        # SLA metrics cache: escalation_id -> metrics dict
        self._metrics: dict[str, Any] = {}
        # Active escalation tracking: escalation_id -> start_time
        self._active_escalations: dict[str, datetime] = {}

    async def start_sla_timer(self, escalation_id: str) -> None:
        """Start SLA timer for escalation (REQ-001-US-005-021).

        Args:
            escalation_id: Escalation ID
        """
        now = _utc_now()
        key = f"sla:{escalation_id}"

        timer_data = {"started_at": now.isoformat(), "status": "active"}

        try:
            await self._redis.set(key, json.dumps(timer_data))
        except Exception as e:
            logger.error(f"Failed to start SLA timer for {escalation_id}: {e}")
            raise

        self._active_escalations[escalation_id] = now
        self._metrics[escalation_id] = {
            "started_at": now,
            "breached": False,
            "resolution_time_minutes": 0.0,
            "resolved": False,
        }

        logger.debug(f"Started SLA timer for escalation {escalation_id}")

    async def resolve_escalation(self, escalation_id: str) -> None:
        """Record escalation resolution and compute elapsed time.

        Args:
            escalation_id: Escalation ID being resolved
        """
        now = _utc_now()

        if escalation_id in self._active_escalations:
            started = self._active_escalations.pop(escalation_id)
            elapsed = (now - started).total_seconds() / 60
        elif escalation_id in self._metrics:
            started = self._metrics[escalation_id].get("started_at", now)
            elapsed = (now - started).total_seconds() / 60
        else:
            elapsed = 0.0

        if escalation_id not in self._metrics:
            self._metrics[escalation_id] = {}

        self._metrics[escalation_id]["resolved"] = True
        self._metrics[escalation_id]["resolution_time_minutes"] = elapsed

        logger.info(f"Escalation {escalation_id} resolved in {elapsed:.1f} minutes")

    @traces(spec="001", story="US-005", reqs=["REQ-001-US-005-016"])
    async def check_sla_breach(
        self, escalation_id: str, component: str = "default"
    ) -> bool:
        """Check if SLA has been breached (REQ-001-US-005-022, REQ-001-US-005-023).

        Args:
            escalation_id: Escalation ID
            component: Component name for threshold lookup (default: "default")

        Returns:
            True if SLA breached, False otherwise
        """
        try:
            key = f"sla:{escalation_id}"
            timer_str = await self._redis.get(key)

            if not timer_str:
                return False

            timer_data = json.loads(timer_str)
            started_at = datetime.fromisoformat(timer_data["started_at"])

            # Get SLA threshold from Prolog rules
            threshold_minutes = await self.get_sla_threshold(component)

            elapsed = (_utc_now() - started_at).total_seconds() / 60

            breached = elapsed > threshold_minutes

            if breached:
                # Notify breach (REQ-001-US-005-026)
                await self._notify_sla_breach(escalation_id, elapsed)

                # Update metrics tracking
                self._metrics[escalation_id] = {
                    "breached": True,
                    "resolution_time_minutes": elapsed,
                }

            return breached
        except Exception as e:
            logger.error(f"Failed to check SLA breach for {escalation_id}: {e}")
            return False  # Default to not breached on error

    @traces(spec="001", story="US-005", reqs=["REQ-001-US-005-027"])
    async def get_sla_metrics(self) -> dict[str, Any]:
        """Get SLA metrics (REQ-001-US-005-024).

        Returns:
            Dictionary with total_escalations, avg_resolution_time_minutes,
            breach_count, breach_rate, and active_count.
        """
        total = len(self._metrics)
        breach_count = sum(
            1 for m in self._metrics.values() if m.get("breached", False)
        )
        breach_rate = (breach_count / total) * 100 if total > 0 else 0.0
        active_count = len(self._active_escalations)

        return {
            "total_escalations": total,
            "avg_resolution_time_minutes": (self._calculate_avg_resolution_time()),
            "breach_count": breach_count,
            "breach_rate": breach_rate,
            "active_count": active_count,
        }

    @traces(spec="001", story="US-005", reqs=["REQ-001-US-005-016"])
    async def get_sla_threshold(self, component: str) -> int:
        """Query Prolog for SLA threshold (REQ-001-US-005-025).

        Args:
            component: Component to get threshold for

        Returns:
            Threshold in minutes
        """
        # Module-qualified + atom-quoted (same F4-class fix as handler.py's
        # pam: queries — a bare volk-style component like "U:Cd" would parse
        # as module-qualification, not an atom).
        query = f"pam:sla_threshold({_quote_atom(component)}, Minutes)"

        try:
            loop = asyncio.get_event_loop()
            result = await loop.run_in_executor(None, self._prolog.query_one, query)

            if result and "Minutes" in result:
                return result["Minutes"]
        except Exception as e:
            logger.error(f"Prolog query failed for SLA threshold: {e}")

        return 30  # Default 30 minutes

    @traces(spec="001", story="US-003", reqs=["REQ-001-US-003-026"])
    async def _notify_sla_breach(
        self, escalation_id: str, elapsed_minutes: float
    ) -> None:
        """Notify stakeholders of SLA breach (REQ-001-US-005-026).

        Args:
            escalation_id: Escalation ID
            elapsed_minutes: Time elapsed in minutes
        """
        message = (
            f"SLA BREACH: Escalation {escalation_id} exceeded threshold "
            f"({elapsed_minutes:.1f} minutes)"
        )

        await self._send_to_channels(message)
        await self._store_breach_notification(escalation_id, elapsed_minutes)
        await self._audit_breach_to_graph(escalation_id, elapsed_minutes)

    async def _send_to_channels(self, message: str) -> None:
        """Deliver message to all notification channels.

        Args:
            message: Notification message to deliver
        """
        for channel in self._channels:
            try:
                await channel.send(message)
            except Exception as e:
                logger.error(
                    f"Notification channel {type(channel).__name__} failed: {e}"
                )

    @traces(spec="001", story="US-005", reqs=["REQ-001-US-005-016"])
    async def _store_breach_notification(
        self, escalation_id: str, elapsed_minutes: float
    ) -> None:
        """Store breach notification in Redis.

        Args:
            escalation_id: Escalation ID
            elapsed_minutes: Time elapsed in minutes
        """
        notification_key = f"sla_notification:{escalation_id}"
        notification_data = {
            "escalation_id": escalation_id,
            "elapsed_minutes": elapsed_minutes,
            "breached_at": _utc_now().isoformat(),
            "action": "sla_breach",
        }

        try:
            await self._redis.set(notification_key, json.dumps(notification_data))
        except Exception as e:
            logger.error(f"Failed to store SLA notification for {escalation_id}: {e}")

    @traces(spec="001", story="US-008", reqs=["REQ-001-US-008-011"])
    async def _audit_breach_to_graph(
        self, escalation_id: str, elapsed_minutes: float
    ) -> None:
        """Log breach event to graph audit trail.

        Args:
            escalation_id: Escalation ID
            elapsed_minutes: Time elapsed in minutes
        """
        if not self._graph:
            return

        from orchestrata_ultimate.orchestrator.graph_audit import (  # noqa: PLC0415
            AuditEvent,
            AuditEventType,
        )

        event = AuditEvent(
            event_type=AuditEventType.ESCALATION,
            session_id=escalation_id,
            volk_id="sla_tracker",
            timestamp=_utc_now(),
            data={
                "escalation_id": escalation_id,
                "elapsed_minutes": elapsed_minutes,
                "action": "sla_breach",
            },
        )
        await self._graph.log_event(event)

    @traces(spec="001", story="US-005", reqs=["REQ-001-US-005-027"])
    def _calculate_avg_resolution_time(self) -> float:
        """Calculate average resolution time from metrics.

        Returns:
            Average resolution time in minutes
        """
        if not self._metrics:
            return 0.0

        total_time = sum(
            m.get("resolution_time_minutes", 0) for m in self._metrics.values()
        )

        return total_time / len(self._metrics)

    def _calculate_compliance_percentage(self) -> float:
        """Calculate SLA compliance percentage.

        Returns:
            Compliance percentage
        """
        if not self._metrics:
            return 100.0

        compliant = sum(
            1 for m in self._metrics.values() if not m.get("breached", False)
        )

        return (compliant / len(self._metrics)) * 100