orchestrata_ultimate.core.tracing
Reference › orchestrata_ultimate › core › tracing
Per-iteration trace log for debugging pipeline behavior.
Tracing in core covers four different jobs, described together in the curated core narrative.
- Pipeline debugging: the package root defines
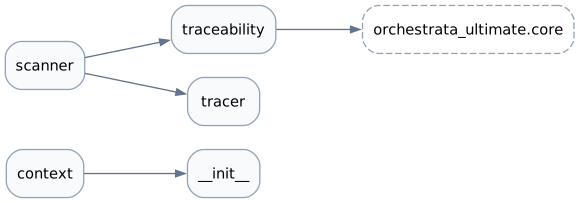
IterationTracer, a JSONL event log per iteration, and context registers one per pipeline thread id so volks can find it. - Generated-code tracing: tracer is the small environment-gated
Tracerinjected into generated tool skeletons. - Requirement scanning: scanner extracts
@tracesannotations from parsed source, and traceability is a superseded shim over core.traceability. - Test-time call graphs: runtime_callgraph is a pytest plugin that records runtime edges.
Control flow: a pipeline run opens pipeline_trace; volks write events to the registered tracer; scripts and the graph-sync code call the scanner. The sys.monitoring engine for function spans is in core.monitoring. Start with the package root and scanner.
6 modules, 1,109 lines of code.
Modules
| Module | Summary | LOC |
|---|---|---|
__init__ |
Per-iteration trace log for debugging pipeline behavior. | 316 |
context |
Run-scoped :class:IterationTracer registry keyed by pipeline thread_id. |
106 |
runtime_callgraph |
Runtime call-graph capture — a pytest plugin (SPEC-023 traceability). | 131 |
scanner |
AST scanner for @traces decorator annotations. | 365 |
traceability |
Requirement traceability annotations -- SUPERSEDED, thin shim. | 36 |
tracer |
Injected, config-gated runtime tracer for generated Command boilerplate. | 155 |
Dependency diagram