orchestrata_ultimate.core.monitoring.engine
Reference › orchestrata_ultimate › core › monitoring › engine
A function-tracing engine built on sys.monitoring (PEP 669, Python 3.12 and later), producing the Span records of the package. The design costs nothing when tracing is off: callbacks are registered, but events fire only for code objects passed to enable_for. The ORCHESTRATA_TRACE environment variable sets the level, read by _get_trace_level and clamped to the range 0 to 3: 0 is off (the default), 1 records function entry, exit and timing, 2 adds line events, and 3 adds exception and branch events.
TracerEngine claims tool id 3 under the name orchestrata-tracer (if another tool already holds it, a warning is logged and tracing stays off). start registers the callbacks, stop unregisters them, enable_for turns monitoring on for one function, and set_label attaches a label to its code object. The _on_py_start, _on_py_return, _on_line, _on_raise and _on_unwind callbacks open and close one in-flight span per thread. Finished spans go into a ring buffer, a deque with a maximum length, from which get_spans and get_slow_spans(threshold_ms) read; reset clears everything. All mutable state is guarded by a threading.Lock, which is required under free-threaded Python 3.14t.
The monitor decorator, usable with or without a label, registers a function with the module-level tracer. With tracing off it calls the function directly. If sys.monitoring is handling the spans it calls through, and otherwise it records the span itself as a fallback. The ToolInterceptor in core.adapters is a documented consumer of the span model in the core narrative.
At a glance
| Source | src/orchestrata_ultimate/core/monitoring/engine.py |
| Lines of code | 424 |
| Classes | 1 |
| Functions | 2 |
| Imports (internal) | orchestrata_ultimate.core.base.traces, orchestrata_ultimate.core.monitoring.spans |
| Imported by | orchestrata_ultimate.core.monitoring |
| Tests that import it | tests/core/test_monitoring.py, tests/generated_core/test_monitoring_engine_generated.py, tests/test_core.py |
Class diagram
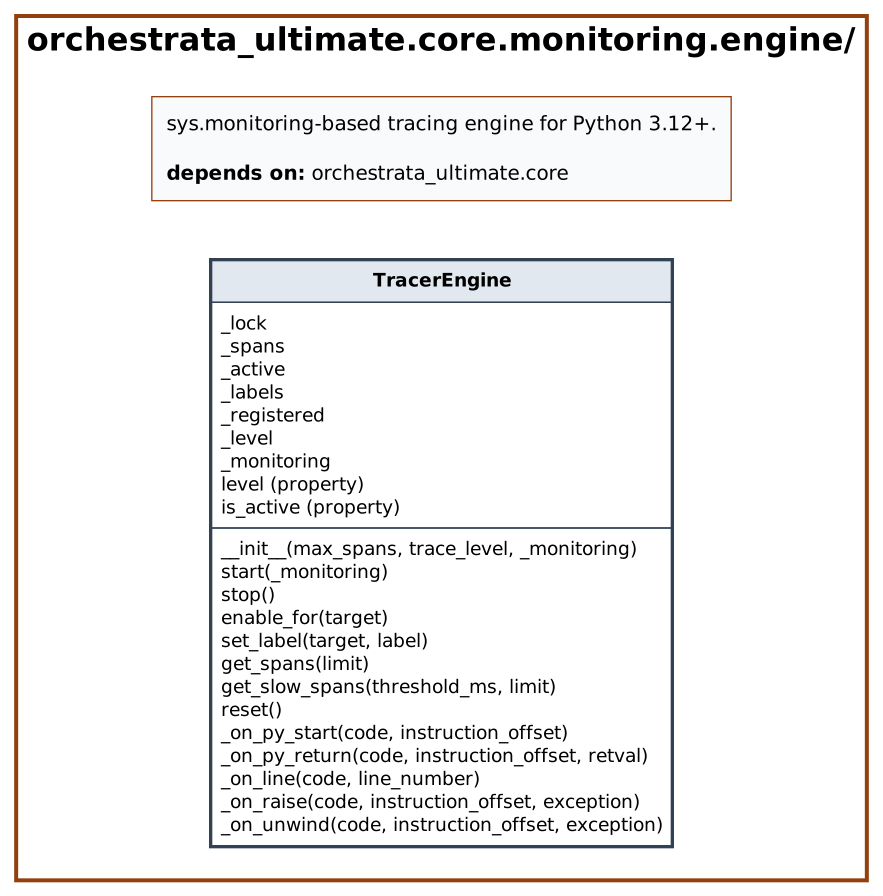
Dependency diagram

API
Classes
TracerEngine
Decorators: traces(spec='001', story='US-010', reqs=['REQ-001-US-010-017', 'REQ-001-US-010-019']) · Line 65
Low-overhead execution tracer using sys.monitoring.
| Method | Signature | Summary |
|---|---|---|
__init__ |
__init__(max_spans: int = _DEFAULT_MAX_SPANS, trace_level: int | None = None, _monitoring: ModuleType | None = None) -> None |
|
level property |
level() -> int |
Current trace level. |
is_active property |
is_active() -> bool |
Whether tracing is enabled. |
start |
start(_monitoring: ModuleType | None = None) -> None |
Register callbacks with sys.monitoring. |
stop |
stop() -> None |
Unregister from sys.monitoring. |
enable_for |
enable_for(target: Callable | CodeType) -> None |
Enable local monitoring events for a specific function. |
set_label |
set_label(target: Callable, label: str) -> None |
Associate a human-readable label with a function's code object. |
get_spans |
get_spans(limit: int = 100) -> list[Span] |
Return the most recent spans. |
get_slow_spans |
get_slow_spans(threshold_ms: float = 100.0, limit: int = 50) -> list[Span] |
Return spans slower than threshold. |
reset |
reset() -> None |
Clear all collected spans and in-flight state. |
_on_py_start |
_on_py_start(code: CodeType, instruction_offset: int) -> None |
PY_START: a Python function has been entered. |
_on_py_return |
_on_py_return(code: CodeType, instruction_offset: int, retval: Any) -> None |
PY_RETURN / PY_YIELD: function is returning a value. |
_on_line |
_on_line(code: CodeType, line_number: int) -> None |
LINE: about to execute a new source line. |
_on_raise |
_on_raise(code: CodeType, instruction_offset: int, exception: BaseException) -> None |
RAISE: an exception has been raised. |
_on_unwind |
_on_unwind(code: CodeType, instruction_offset: int, exception: BaseException) -> None |
PY_UNWIND: function exiting due to exception propagation. |
Functions
| Function | Signature | Summary |
|---|---|---|
_get_trace_level |
_get_trace_level(environ: dict[str, str] | None = None) -> int |
Read trace level from environment. |
monitor traces |
monitor(func: Callable | None = None, *, label: str = '') -> Callable |
Decorator to trace a function's execution. |
Source
# mypy: ignore-errors
"""sys.monitoring-based tracing engine for Python 3.12+.

Uses PEP 669 low-overhead monitoring to trace function entry/exit with
nanosecond-precision timing.  Zero cost when disabled — sys.monitoring
only fires events for code objects that have been explicitly enabled.

Thread safety: all mutable state is protected by threading.Lock.
Under Python 3.14t (free-threaded, no GIL) this is mandatory.

Environment:
    ORCHESTRATA_TRACE=0  disabled (default)
    ORCHESTRATA_TRACE=1  function entry/exit + timing
    ORCHESTRATA_TRACE=2  + line events
    ORCHESTRATA_TRACE=3  + exception + branch events
"""

import functools
import logging
import os
import sys
import threading
import time
from collections import deque
from collections.abc import Callable
from types import CodeType, ModuleType
from typing import Any

from orchestrata_ultimate.core.base.traces import traces
from orchestrata_ultimate.core.monitoring.spans import Span, SpanStatus, _make_span

logger = logging.getLogger(__name__)

# Tool ID 3 — avoids conflict with DEBUGGER(0), COVERAGE(1),
# PROFILER(2), and OPTIMIZER(5) which other tools may claim.
_TOOL_ID = 3
_TOOL_NAME = "orchestrata-tracer"

# Maximum spans retained in the ring buffer before oldest are evicted.
_DEFAULT_MAX_SPANS = 10_000

# Trace levels
TRACE_OFF = 0
TRACE_FUNCTIONS = 1
TRACE_LINES = 2
TRACE_FULL = 3


def _get_trace_level(environ: dict[str, str] | None = None) -> int:
    """Read trace level from environment.

    Args:
        environ: Optional environment mapping (defaults to os.environ).
    """
    env = os.environ if environ is None else environ
    raw = env.get("ORCHESTRATA_TRACE", "0")
    try:
        level = int(raw)
    except ValueError:
        return TRACE_OFF
    return max(TRACE_OFF, min(TRACE_FULL, level))


@traces(spec="001", story="US-010", reqs=["REQ-001-US-010-017", "REQ-001-US-010-019"])
class TracerEngine:
    """Low-overhead execution tracer using sys.monitoring.

    Manages a ring buffer of Span objects and controls which code
    objects have monitoring enabled.  Thread-safe under free-threading.

    Args:
        max_spans: Maximum number of spans to retain.
        trace_level: Override the ORCHESTRATA_TRACE env var.
    """

    @traces(spec="001", story="US-010", reqs=["REQ-001-US-010-017"])
    def __init__(
        self,
        max_spans: int = _DEFAULT_MAX_SPANS,
        trace_level: int | None = None,
        _monitoring: ModuleType | None = None,
    ) -> None:
        self._lock = threading.Lock()
        self._spans: deque[Span] = deque(maxlen=max_spans)
        self._active: dict[int, Span] = {}  # thread_id -> in-flight span
        self._labels: dict[int, str] = {}  # code id -> label
        self._registered = False
        self._level = trace_level if trace_level is not None else _get_trace_level()
        self._monitoring = _monitoring

    @property
    def level(self) -> int:
        """Current trace level."""
        return self._level

    @property
    def is_active(self) -> bool:
        """Whether tracing is enabled."""
        return self._level > TRACE_OFF and self._registered

    def start(self, _monitoring: ModuleType | None = None) -> None:
        """Register callbacks with sys.monitoring.

        Registers event callbacks but does NOT enable global events.
        Events are only fired for code objects explicitly passed to
        enable_for() — this is the zero-overhead design.  Unregistered
        functions have no monitoring cost whatsoever.

        Safe to call multiple times — subsequent calls are no-ops.

        Args:
            _monitoring: Optional monitoring module override for testing.
        """
        if self._registered:
            return
        if self._level == TRACE_OFF:
            return

        monitoring = _monitoring or self._monitoring or sys.monitoring

        try:
            monitoring.use_tool_id(_TOOL_ID, _TOOL_NAME)
        except ValueError:
            logger.warning(
                "sys.monitoring tool ID %d already claimed — tracing disabled",
                _TOOL_ID,
            )
            return

        events = monitoring.events

        # Register callbacks for all levels.  These are inert until
        # set_local_events() activates them on specific code objects.

        # Level 1+: function entry, exit (normal + exception)
        monitoring.register_callback(_TOOL_ID, events.PY_START, self._on_py_start)
        monitoring.register_callback(_TOOL_ID, events.PY_RETURN, self._on_py_return)
        monitoring.register_callback(_TOOL_ID, events.PY_YIELD, self._on_py_return)
        # Level 2+: line events (local per code object)
        if self._level >= TRACE_LINES:
            monitoring.register_callback(_TOOL_ID, events.LINE, self._on_line)

        # PY_UNWIND and RAISE are global-only events — cannot be set
        # per code object.  Set them globally; callbacks filter by
        # checking if the thread has an active span from a monitored
        # function.
        global_mask = events.PY_UNWIND
        monitoring.register_callback(_TOOL_ID, events.PY_UNWIND, self._on_unwind)
        if self._level >= TRACE_FULL:
            global_mask |= events.RAISE
            monitoring.register_callback(_TOOL_ID, events.RAISE, self._on_raise)
        monitoring.set_events(_TOOL_ID, global_mask)

        self._registered = True
        logger.debug(
            "Tracer registered at level %d (global=0x%x, local per fn)",
            self._level,
            global_mask,
        )

    def stop(self) -> None:
        """Unregister from sys.monitoring.

        Clears all callbacks and releases the tool ID.
        """
        if not self._registered:
            return

        monitoring = self._monitoring or sys.monitoring
        monitoring.set_events(_TOOL_ID, 0)

        events = monitoring.events
        for event in (
            events.PY_START,
            events.PY_RETURN,
            events.PY_YIELD,
            events.LINE,
            events.RAISE,
            events.PY_UNWIND,
        ):
            monitoring.register_callback(_TOOL_ID, event, None)

        monitoring.free_tool_id(_TOOL_ID)
        self._registered = False
        logger.debug("Tracer stopped")

    def enable_for(self, target: Callable | CodeType) -> None:
        """Enable local monitoring events for a specific function.

        This is how you get per-function tracing without global overhead.
        Only code objects passed here will fire PY_START/PY_RETURN events.

        Args:
            target: A function or code object to trace.
        """
        if not self._registered:
            self.start()
        if not self._registered:
            return  # Monitoring unavailable (e.g., tool ID already claimed)

        code: CodeType = (
            target.__code__  # type: ignore[union-attr]
            if hasattr(target, "__code__")
            else target  # type: ignore[assignment]
        )
        monitoring = self._monitoring or sys.monitoring
        events = monitoring.events
        # Only local-capable events here.  PY_UNWIND and RAISE are
        # global-only — handled by set_events() in start().
        local_mask = events.PY_START | events.PY_RETURN | events.PY_YIELD
        if self._level >= TRACE_LINES:
            local_mask |= events.LINE
        monitoring.set_local_events(_TOOL_ID, code, local_mask)

    def set_label(self, target: Callable, label: str) -> None:
        """Associate a human-readable label with a function's code object.

        Args:
            target: The function to label.
            label: Label string (e.g., 'agent.dispatch').
        """
        code = target.__code__ if hasattr(target, "__code__") else target
        with self._lock:
            self._labels[id(code)] = label

    def get_spans(self, limit: int = 100) -> list[Span]:
        """Return the most recent spans.

        Args:
            limit: Maximum number of spans to return.

        Returns:
            List of Span objects, most recent last.
        """
        with self._lock:
            items = list(self._spans)
        return items[-limit:]

    def get_slow_spans(
        self, threshold_ms: float = 100.0, limit: int = 50
    ) -> list[Span]:
        """Return spans slower than threshold.

        Args:
            threshold_ms: Minimum duration in milliseconds.
            limit: Maximum number of spans to return.

        Returns:
            List of slow Span objects, sorted by duration descending.
        """
        threshold_ns = int(threshold_ms * 1_000_000)
        with self._lock:
            slow = [s for s in self._spans if s.duration_ns >= threshold_ns]
        slow.sort(key=lambda s: s.duration_ns, reverse=True)
        return slow[:limit]

    def reset(self) -> None:
        """Clear all collected spans and in-flight state."""
        with self._lock:
            self._spans.clear()
            self._active.clear()

    # ------------------------------------------------------------------
    # sys.monitoring callbacks — called by the VM, must be fast
    # ------------------------------------------------------------------

    def _on_py_start(self, code: CodeType, instruction_offset: int) -> None:
        """PY_START: a Python function has been entered."""
        tid = threading.get_ident()
        label = self._labels.get(id(code), "")
        span = _make_span(
            func_name=code.co_qualname,
            label=label,
            code_file=code.co_filename,
            code_line=code.co_firstlineno,
            thread_id=tid,
        )
        with self._lock:
            self._active[tid] = span

    def _on_py_return(
        self, code: CodeType, instruction_offset: int, retval: Any
    ) -> None:
        """PY_RETURN / PY_YIELD: function is returning a value."""
        tid = threading.get_ident()
        with self._lock:
            span = self._active.pop(tid, None)
        if span is None:
            return
        span.end_ns = time.monotonic_ns()
        span.status = SpanStatus.OK
        with self._lock:
            self._spans.append(span)

    def _on_line(self, code: CodeType, line_number: int) -> None:
        """LINE: about to execute a new source line."""
        # Line events are recorded as log messages at DEBUG level
        # to avoid span buffer pollution.  Only fires at level >= 2.
        logger.debug(
            "TRACE LINE %s:%d in %s",
            code.co_filename,
            line_number,
            code.co_qualname,
        )

    def _on_raise(
        self, code: CodeType, instruction_offset: int, exception: BaseException
    ) -> None:
        """RAISE: an exception has been raised."""
        tid = threading.get_ident()
        with self._lock:
            span = self._active.get(tid)
        if span is None:
            return
        span.status = SpanStatus.ERROR
        span.error_type = type(exception).__name__
        span.error_message = str(exception)[:500]

    def _on_unwind(
        self, code: CodeType, instruction_offset: int, exception: BaseException
    ) -> None:
        """PY_UNWIND: function exiting due to exception propagation."""
        tid = threading.get_ident()
        with self._lock:
            span = self._active.pop(tid, None)
        if span is None:
            return
        span.end_ns = time.monotonic_ns()
        if span.status != SpanStatus.ERROR:
            span.status = SpanStatus.ERROR
            span.error_type = type(exception).__name__
            span.error_message = str(exception)[:500]
        with self._lock:
            self._spans.append(span)


# ------------------------------------------------------------------
# Module-level singleton and decorator
# ------------------------------------------------------------------

#: Global tracer instance — auto-starts based on ORCHESTRATA_TRACE env var.
tracer = TracerEngine()


@traces(spec="001", story="US-010", reqs=["REQ-001-US-010-019"])
def monitor(
    func: Callable | None = None,
    *,
    label: str = "",
) -> Callable:
    """Decorator to trace a function's execution.

    Can be used with or without arguments:

        @monitor
        def foo(): ...

        @monitor(label="agent.dispatch")
        def bar(): ...

    The decorator registers the function with the tracer engine and
    wraps it to record entry/exit spans even when sys.monitoring
    events are not globally enabled (belt-and-suspenders approach).

    Args:
        func: The function to decorate (when used without parentheses).
        label: Optional label for grouping spans.

    Returns:
        Decorated function.
    """

    def _decorator(fn: Callable) -> Callable:
        # Register with the tracer for sys.monitoring-based tracing
        if tracer.level > TRACE_OFF:
            if not tracer.is_active:
                tracer.start()
            tracer.enable_for(fn)
            if label:
                tracer.set_label(fn, label)

        @functools.wraps(fn)
        def _wrapper(*args: Any, **kwargs: Any) -> Any:
            if tracer.level == TRACE_OFF:
                # Zero overhead — direct call, no span creation.
                return fn(*args, **kwargs)

            if tracer.is_active:
                # sys.monitoring is handling span creation via
                # PY_START/PY_RETURN callbacks.  Just call through.
                return fn(*args, **kwargs)

            # Fallback: sys.monitoring not available (e.g., tool ID
            # was claimed by another tool).  Decorator records spans.
            tid = threading.get_ident()
            code = fn.__code__
            lbl = label or tracer._labels.get(id(code), "")
            span = _make_span(
                func_name=code.co_qualname,
                label=lbl,
                code_file=code.co_filename,
                code_line=code.co_firstlineno,
                thread_id=tid,
            )
            try:
                result = fn(*args, **kwargs)
                span.end_ns = time.monotonic_ns()
                span.status = SpanStatus.OK
                return result
            except BaseException as exc:
                span.end_ns = time.monotonic_ns()
                span.status = SpanStatus.ERROR
                span.error_type = type(exc).__name__
                span.error_message = str(exc)[:500]
                raise
            finally:
                with tracer._lock:
                    tracer._spans.append(span)

        return _wrapper

    if func is not None:
        return _decorator(func)
    return _decorator