orchestrata_ultimate.kernel.performance.metrics
Reference › orchestrata_ultimate › kernel › performance › metrics
The measurement trackers of the performance package, SPEC-001 story US-010 (REQ-001-US-010-001 to -004 for latency and the related throughput, memory and uptime targets). manager owns one of each and feeds them from the routing and policy paths.
LatencyTrackerkeeps a bounded number ofLatencyMeasurementsamples for one named operation.recordadds a duration and a success flag,get_percentile,get_p95andget_p99read percentiles,get_meanthe mean,get_statsa summary andresetclears it. Percentile getters return None with no samples.ThroughputTrackercounts events in a sliding window (one second by default):recordadds a count,_prune_olddrops old entries,get_ratereturns the rate andget_totalthe total.MemoryTrackerrecords bytes per session; it reports one session in megabytes, the average, the total and the session count, andremove_sessionforgets a session.UptimeTrackertracks time up and down throughstart,mark_downandmark_up, andget_uptime_percentreturns the proportion up.
At a glance
| Source | src/orchestrata_ultimate/kernel/performance/metrics.py |
| Lines of code | 339 |
| Classes | 5 |
| Functions | 0 |
| Imports (internal) | orchestrata_ultimate.core.base.traces, orchestrata_ultimate.kernel.performance._common |
| Imported by | orchestrata_ultimate.kernel.performance, orchestrata_ultimate.kernel.performance.manager |
| Tests that import it | none |
Class diagram
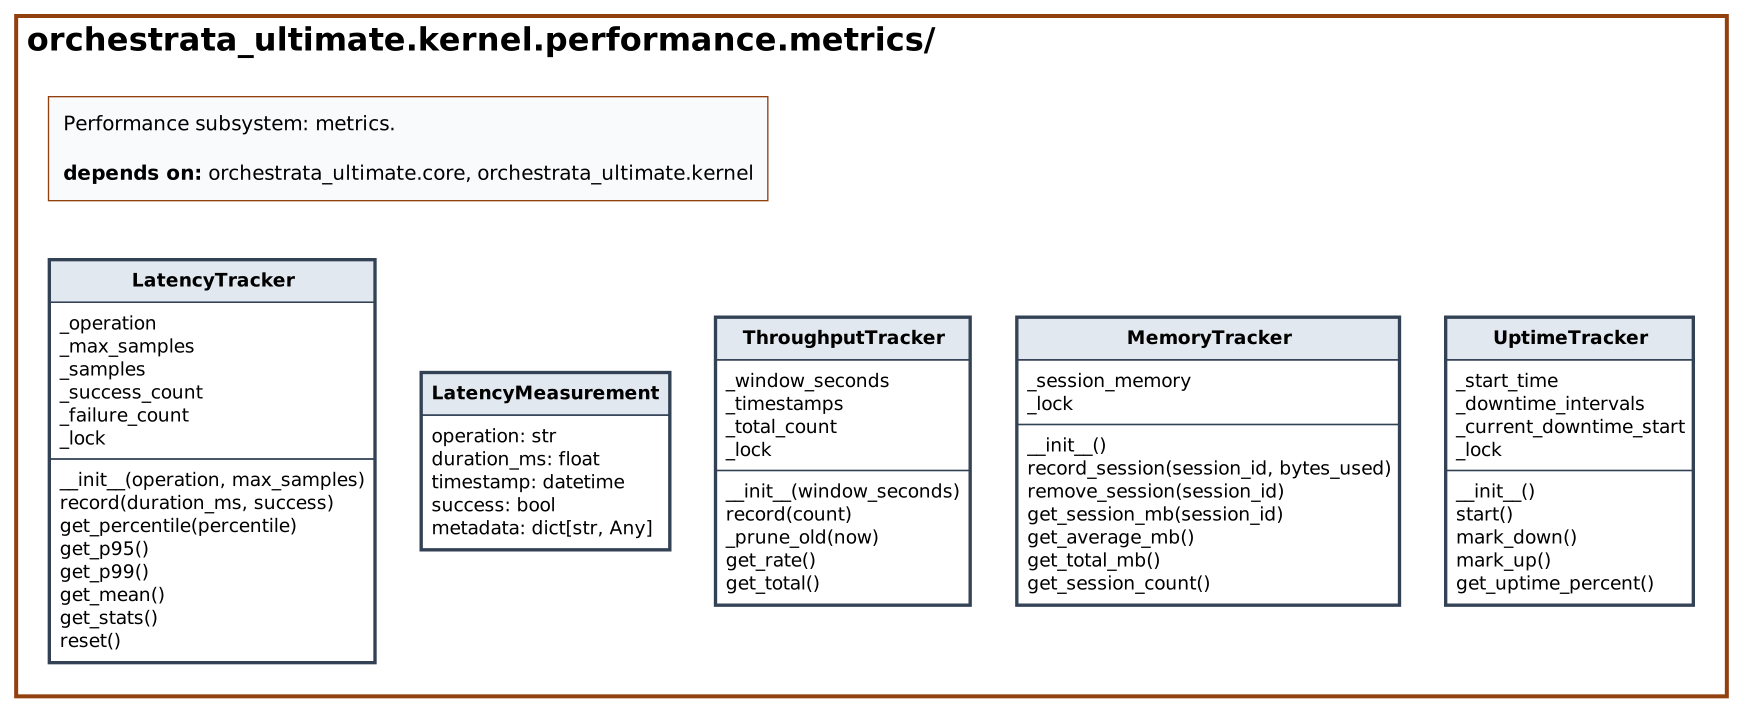
Dependency diagram

API
Classes
LatencyMeasurement (dataclass)
Decorators: dataclass · Line 20
Single latency measurement.
| Attribute | Type | Default |
|---|---|---|
operation |
str |
|
duration_ms |
float |
|
timestamp |
datetime |
|
success |
bool |
|
metadata |
dict[str, Any] |
field(default_factory=dict) |
LatencyTracker
Decorators: traces(spec='001', story='US-010', reqs=['REQ-001-US-010-001', 'REQ-001-US-010-002', 'REQ-001-US-010-003', 'REQ-001-US-… · Line 40
Tracks latency measurements with percentile calculation (REQ-001-US-010-001 to REQ-001-US-010-004).
| Method | Signature | Summary |
|---|---|---|
__init__ |
__init__(operation: str, max_samples: int = LATENCY_TRACKER_MAX_SAMPLES) -> None |
Initialize latency tracker. |
record |
record(duration_ms: float, success: bool = True) -> None |
Record a latency measurement. |
get_percentile |
get_percentile(percentile: float) -> float | None |
Get latency at given percentile. |
get_p95 |
get_p95() -> float | None |
Get p95 latency. |
get_p99 |
get_p99() -> float | None |
Get p99 latency. |
get_mean |
get_mean() -> float | None |
Get mean latency. |
get_stats |
get_stats() -> dict[str, Any] |
Get all latency statistics. |
reset |
reset() -> None |
Reset all measurements. |
ThroughputTracker
Decorators: traces(spec='001', story='US-010', reqs=['REQ-001-US-010-005']) · Line 165
Tracks message throughput (REQ-001-US-010-005).
| Method | Signature | Summary |
|---|---|---|
__init__ |
__init__(window_seconds: float = 1.0) -> None |
Initialize throughput tracker. |
record |
record(count: int = 1) -> None |
Record message(s) processed. |
_prune_old |
_prune_old(now: float) -> None |
Remove timestamps outside window. |
get_rate |
get_rate() -> float |
Get current throughput rate (messages/second). |
get_total |
get_total() -> int |
Get total messages processed. |
MemoryTracker
Decorators: traces(spec='001', story='US-010', reqs=['REQ-001-US-010-006']) · Line 220
Tracks memory usage per session (REQ-001-US-010-006).
| Method | Signature | Summary |
|---|---|---|
__init__ |
__init__() -> None |
Initialize memory tracker. |
record_session |
record_session(session_id: str, bytes_used: int) -> None |
Record memory usage for session. |
remove_session |
remove_session(session_id: str) -> None |
Remove session from tracking. |
get_session_mb |
get_session_mb(session_id: str) -> float | None |
Get memory usage for session in MB. |
get_average_mb |
get_average_mb() -> float | None |
Get average memory per session in MB. |
get_total_mb |
get_total_mb() -> float |
Get total memory across all sessions in MB. |
get_session_count |
get_session_count() -> int |
Get number of tracked sessions. |
UptimeTracker
Decorators: traces(spec='001', story='US-010', reqs=['REQ-001-US-010-009']) · Line 283
Tracks system uptime (REQ-001-US-010-009).
| Method | Signature | Summary |
|---|---|---|
__init__ |
__init__() -> None |
Initialize uptime tracker. |
start |
start() -> None |
Mark system as started. |
mark_down |
mark_down() -> None |
Mark system as down. |
mark_up |
mark_up() -> None |
Mark system as up. |
get_uptime_percent |
get_uptime_percent() -> float |
Get uptime percentage. |
Source
# mypy: ignore-errors
"""Performance subsystem: metrics."""

import collections
import statistics
import threading
import time
from dataclasses import dataclass, field
from datetime import datetime
from typing import Any

from orchestrata_ultimate.core.base.traces import traces
from orchestrata_ultimate.kernel.performance._common import (
    LATENCY_TRACKER_MAX_SAMPLES,
    _utc_now,
)


@dataclass
class LatencyMeasurement:
    """Single latency measurement."""

    operation: str
    duration_ms: float
    timestamp: datetime
    success: bool
    metadata: dict[str, Any] = field(default_factory=dict)


@traces(
    spec="001",
    story="US-010",
    reqs=[
        "REQ-001-US-010-001",
        "REQ-001-US-010-002",
        "REQ-001-US-010-003",
        "REQ-001-US-010-004",
    ],
)
class LatencyTracker:
    """Tracks latency measurements with percentile calculation (REQ-001-US-010-001 to REQ-001-US-010-004).

    Uses a ring buffer for efficient memory usage (REQ-010-017).
    """

    def __init__(
        self, operation: str, max_samples: int = LATENCY_TRACKER_MAX_SAMPLES
    ) -> None:
        """Initialize latency tracker.

        Args:
            operation: Name of operation being tracked
            max_samples: Maximum samples to retain (ring buffer size)
        """
        self._operation = operation
        self._max_samples = max_samples
        self._samples: collections.deque[float] = collections.deque(maxlen=max_samples)
        self._success_count = 0
        self._failure_count = 0
        self._lock = threading.Lock()

    def record(self, duration_ms: float, success: bool = True) -> None:
        """Record a latency measurement.

        Args:
            duration_ms: Duration in milliseconds
            success: Whether operation succeeded
        """
        with self._lock:
            self._samples.append(duration_ms)
            if success:
                self._success_count += 1
            else:
                self._failure_count += 1

    @traces(
        spec="001",
        story="US-010",
        reqs=[
            "REQ-001-US-010-001",
            "REQ-001-US-010-002",
            "REQ-001-US-010-003",
            "REQ-001-US-010-004",
        ],
    )
    def get_percentile(self, percentile: float) -> float | None:
        """Get latency at given percentile.

        Args:
            percentile: Percentile (0-100)

        Returns:
            Latency at percentile or None if no samples
        """
        with self._lock:
            if not self._samples:
                return None
            sorted_samples = sorted(self._samples)
            idx = int(len(sorted_samples) * percentile / 100)
            idx = min(idx, len(sorted_samples) - 1)
            return sorted_samples[idx]

    @traces(
        spec="001",
        story="US-010",
        reqs=["REQ-001-US-010-001", "REQ-001-US-010-003"],
    )
    def get_p95(self) -> float | None:
        """Get p95 latency."""
        return self.get_percentile(95)

    @traces(
        spec="001",
        story="US-010",
        reqs=["REQ-001-US-010-002", "REQ-001-US-010-004"],
    )
    def get_p99(self) -> float | None:
        """Get p99 latency."""
        return self.get_percentile(99)

    def get_mean(self) -> float | None:
        """Get mean latency."""
        with self._lock:
            if not self._samples:
                return None
            return statistics.mean(self._samples)

    def get_stats(self) -> dict[str, Any]:
        """Get all latency statistics."""
        with self._lock:
            if not self._samples:
                return {
                    "operation": self._operation,
                    "sample_count": 0,
                    "success_count": self._success_count,
                    "failure_count": self._failure_count,
                }

            sorted_samples = sorted(self._samples)
            return {
                "operation": self._operation,
                "sample_count": len(self._samples),
                "success_count": self._success_count,
                "failure_count": self._failure_count,
                "min_ms": min(sorted_samples),
                "max_ms": max(sorted_samples),
                "mean_ms": statistics.mean(sorted_samples),
                "median_ms": statistics.median(sorted_samples),
                "p95_ms": sorted_samples[int(len(sorted_samples) * 0.95)],
                "p99_ms": sorted_samples[int(len(sorted_samples) * 0.99)],
                "stddev_ms": (
                    statistics.stdev(sorted_samples) if len(sorted_samples) > 1 else 0
                ),
            }

    def reset(self) -> None:
        """Reset all measurements."""
        with self._lock:
            self._samples.clear()
            self._success_count = 0
            self._failure_count = 0


@traces(spec="001", story="US-010", reqs=["REQ-001-US-010-005"])
class ThroughputTracker:
    """Tracks message throughput (REQ-001-US-010-005).

    Uses sliding window for accurate rate calculation.
    """

    def __init__(self, window_seconds: float = 1.0) -> None:
        """Initialize throughput tracker.

        Args:
            window_seconds: Size of sliding window in seconds
        """
        self._window_seconds = window_seconds
        self._timestamps: collections.deque[float] = collections.deque()
        self._total_count = 0
        self._lock = threading.Lock()

    def record(self, count: int = 1) -> None:
        """Record message(s) processed.

        Args:
            count: Number of messages processed
        """
        now = time.monotonic()
        with self._lock:
            for _ in range(count):
                self._timestamps.append(now)
            self._total_count += count
            self._prune_old(now)

    @traces(spec="001", story="US-010", reqs=["REQ-001-US-010-005"])
    def _prune_old(self, now: float) -> None:
        """Remove timestamps outside window."""
        cutoff = now - self._window_seconds
        while self._timestamps and self._timestamps[0] < cutoff:
            self._timestamps.popleft()

    @traces(spec="001", story="US-010", reqs=["REQ-001-US-010-005"])
    def get_rate(self) -> float:
        """Get current throughput rate (messages/second).

        Returns:
            Current rate in messages per second
        """
        now = time.monotonic()
        with self._lock:
            self._prune_old(now)
            return len(self._timestamps) / self._window_seconds

    def get_total(self) -> int:
        """Get total messages processed."""
        return self._total_count


@traces(spec="001", story="US-010", reqs=["REQ-001-US-010-006"])
class MemoryTracker:
    """Tracks memory usage per session (REQ-001-US-010-006)."""

    def __init__(self) -> None:
        """Initialize memory tracker."""
        self._session_memory: dict[str, int] = {}
        self._lock = threading.Lock()

    def record_session(self, session_id: str, bytes_used: int) -> None:
        """Record memory usage for session.

        Args:
            session_id: Session identifier
            bytes_used: Current bytes used by session
        """
        with self._lock:
            self._session_memory[session_id] = bytes_used

    def remove_session(self, session_id: str) -> None:
        """Remove session from tracking.

        Args:
            session_id: Session identifier
        """
        with self._lock:
            self._session_memory.pop(session_id, None)

    @traces(spec="001", story="US-010", reqs=["REQ-001-US-010-006"])
    def get_session_mb(self, session_id: str) -> float | None:
        """Get memory usage for session in MB.

        Args:
            session_id: Session identifier

        Returns:
            Memory in MB or None if not tracked
        """
        with self._lock:
            bytes_used = self._session_memory.get(session_id)
            if bytes_used is None:
                return None
            return bytes_used / (1024 * 1024)

    def get_average_mb(self) -> float | None:
        """Get average memory per session in MB."""
        with self._lock:
            if not self._session_memory:
                return None
            total_bytes = sum(self._session_memory.values())
            return (total_bytes / len(self._session_memory)) / (1024 * 1024)

    def get_total_mb(self) -> float:
        """Get total memory across all sessions in MB."""
        with self._lock:
            return sum(self._session_memory.values()) / (1024 * 1024)

    def get_session_count(self) -> int:
        """Get number of tracked sessions."""
        with self._lock:
            return len(self._session_memory)


@traces(spec="001", story="US-010", reqs=["REQ-001-US-010-009"])
class UptimeTracker:
    """Tracks system uptime (REQ-001-US-010-009)."""

    def __init__(self) -> None:
        """Initialize uptime tracker."""
        self._start_time: datetime | None = None
        self._downtime_intervals: list[tuple[datetime, datetime]] = []
        self._current_downtime_start: datetime | None = None
        self._lock = threading.Lock()

    def start(self) -> None:
        """Mark system as started."""
        with self._lock:
            self._start_time = _utc_now()
            self._current_downtime_start = None

    def mark_down(self) -> None:
        """Mark system as down."""
        with self._lock:
            if self._current_downtime_start is None:
                self._current_downtime_start = _utc_now()

    def mark_up(self) -> None:
        """Mark system as up."""
        with self._lock:
            if self._current_downtime_start is not None:
                self._downtime_intervals.append(
                    (self._current_downtime_start, _utc_now())
                )
                self._current_downtime_start = None

    @traces(spec="001", story="US-010", reqs=["REQ-001-US-010-009"])
    def get_uptime_percent(self) -> float:
        """Get uptime percentage.

        Returns:
            Uptime as percentage (0-100)
        """
        with self._lock:
            if self._start_time is None:
                return 100.0

            now = _utc_now()
            total_seconds = (now - self._start_time).total_seconds()
            if total_seconds <= 0:
                return 100.0

            downtime_seconds = 0.0
            for start, end in self._downtime_intervals:
                downtime_seconds += (end - start).total_seconds()

            # Add current downtime if system is down
            if self._current_downtime_start is not None:
                downtime_seconds += (now - self._current_downtime_start).total_seconds()

            uptime_seconds = total_seconds - downtime_seconds
            return (uptime_seconds / total_seconds) * 100