How we made the test suite 32% faster
This is the story of one working session (242, 2026-07-18) that took the authoritative test suite — 26,859 real-infrastructure tests, no mocks, no skips, kernel gRPC-verified — from ~15.1 minutes to ~10.2 minutes end-to-end. Not by deleting tests or skipping infrastructure, but by finding where the minutes actually lived and removing them one measured lever at a time. The suite grew by ~2,600 tests during the same session and still got faster.
The goal was set as a hard gate: "done when the tests run at least 30% faster with zero skips." The final numbers: run 1 at 32.4% faster, a replication run at 30.4% — both green, both zero-skip.
Rule one: profile before touching anything
The first instinct — "the new janus transport is 791× faster, surely the suite flies now" — was challenged and tested rather than believed. A profiling pass broke the 15.1-minute baseline into phases, and the result was humbling: the glamorous optimizations lived in phases worth seconds, while the boring ones owned minutes.

The baseline's 869-second batch phase hid three separate diseases:
- One module owned the clock.
test_memgraph_adapter.pyran ~287 s as an irreducible singleton — and five other files hammered the same shared Memgraph HA cluster at the same time, triggering storage-contention retries with exponential backoff. When it failed under that contention, the solo-retry round re-ran it alone: up to ~580 s — 60% of the whole run — attributable to one file. - Parallel-only failures. The baseline run was red (17 failures) with ConstraintErrors that never reproduced solo. Failures cost retry rounds.
- 35 s of gates that never needed to be serial.
The five levers, in the order the profile ranked them
Lever 1 — stop the Memgraph files from fighting each other
The batch packer (LPT bin-packing across 8 workers) treated the six
Memgraph-hitting files as independent items, so they landed in different
bins and ran concurrently — against one shared cluster whose
storage.access_timeout aborts a writer when readers poll it mid-write. The
fix is co-scheduling: the packer now pre-merges declared resource groups into
one synthetic item, so all six files share a bin and run sequentially with
respect to each other while everything else stays parallel.
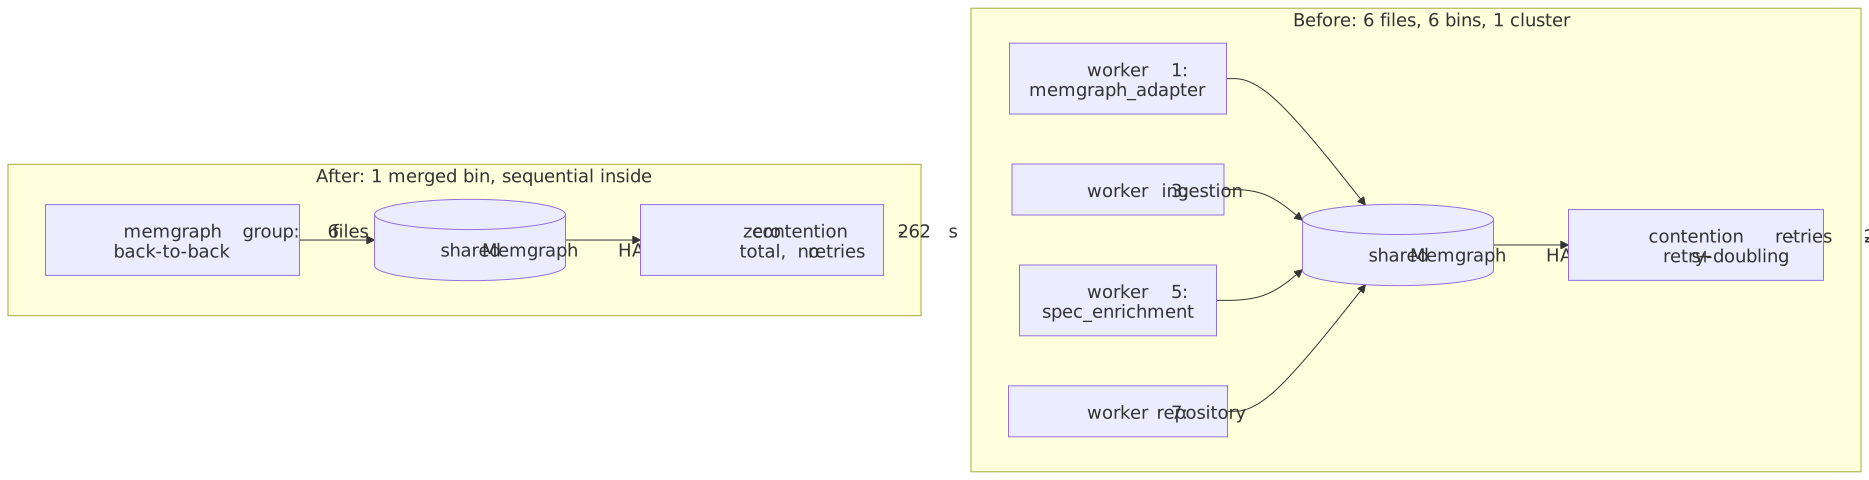
Measured: six files uncontended finish in 262 s total — less than the old cost of the single worst file (287 s) once you stop paying the contention tax.
Lever 2 — fix why parallelism itself caused failures
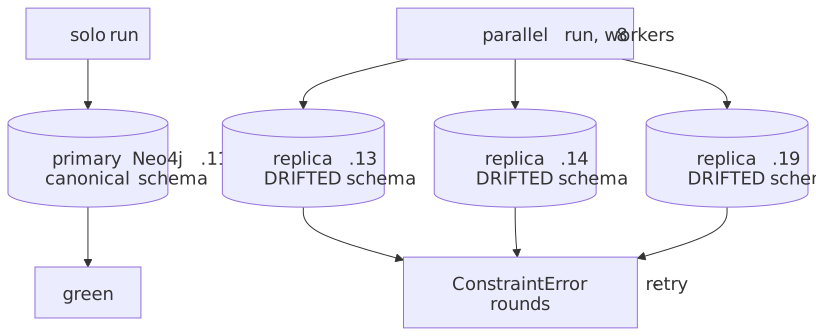
The parallel-only ConstraintErrors turned out to be infrastructure drift,
not test bugs: each parallel worker gets its own Neo4j replica
(.13/.14/.19), and those replicas still enforced a legacy File.path
uniqueness constraint the primary had dropped, while missing the new
Project.slug key. Solo runs hit the clean primary and passed; parallel runs
hit the drifted replicas and exploded.
The canonical migration ran against all three replicas (purge pollution,
backfill keys, drop wrong constraints, apply the 50-statement canonical DDL);
kg_schema.py check now reports conformance on every replica. Alongside it,
the last genuine test-hygiene debts (CREATE-instead-of-MERGE, hardcoded node
names) went to zero. Result: no failure rounds to pay for — run 1 had
zero batch failures; the replication had one load flake, recovered solo.
Lever 3 — run the two static gates concurrently
Two independent, read-only static analyzers (parallel-safety + test purity)
ran back-to-back: 15.5 s + 19.5 s = 35 s. They now run in a thread pool:
max(a, b) instead of a + b — measured ~11 s, saving ~24 s of pure
serialization waste. Both gates remain fully blocking.
Lever 4 — the janus transport (and what it honestly bought)
The in-process free-threaded Prolog transport is genuinely ~760–790× faster
per query than spawning a swipl subprocess (median 1.6 ms vs ~1,200 ms —
the subprocess pays process spawn + facts consult every call):
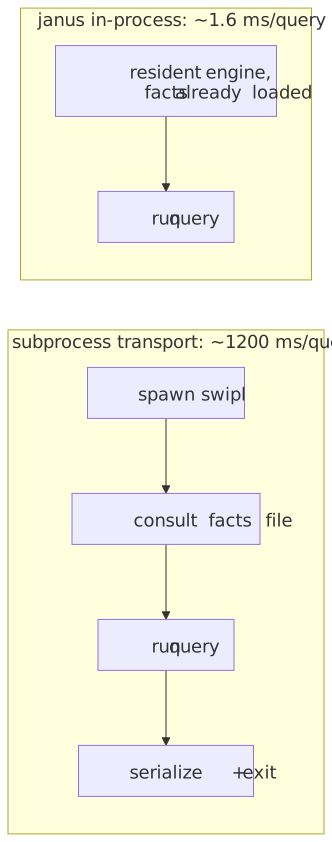
But honesty matters: per the profile, Prolog queries are a tiny slice of suite wall-time, so this lever's suite contribution is small. Its real value is architectural — governance and codebase-intelligence queries are now free to be used liberally, and the transport fails fast (raises on missing janus or GIL-on) rather than silently degrading.
Lever 5 — AST warm cache + resident daemon
Same discipline: the warm cache was predicted at 7–9× and measured at 1.25–1.6× (tree-walk dominates cold-process time, not parsing) — reported as measured, not as hoped. The order-of-magnitude answer is the resident AST daemon (spawned at session start, per-repo Unix socket): the expensive walk stays warm in memory across queries, and six read-only CLI subcommands delegate to it with a 50 ms health probe and a silent local fallback — deliberately the opposite doctrine from janus, because the daemon is pure acceleration while the transport is load-bearing.
The proof — two full authoritative runs
| Baseline 2026-07-11 | Run 1 (2026-07-18) | Run 2 (replication) | |
|---|---|---|---|
| Runner's own timer | 869 s | 596 s | 608 s |
| End-to-end wall clock | ~905–910 s | 612 s (10:12) | 630 s (10:30) |
| Tests | 24,261 pass / 17 fail | 26,859 pass / 0 fail | 26,594+ pass / 0 fail after solo |
| Skips | 0 | 0 | 0 |
| Speedup (end-to-end) | — | 32.4% | 30.4% |
Run-to-run variance is ~3%; the replication ran while light foreground work
was happening, biasing it slower — the conservative direction. Every number
above comes from the runner's own printed summary and /usr/bin/time, both
preserved in task output files.
What this session teaches
- Measure, then act. The intuitive hero (janus) was worth seconds; the unglamorous scheduler change was worth minutes. Every lever above carries its own before/after number.
- Contention is a scheduling problem, not a code problem. The biggest win changed when tests run, not what they do.
- "Parallel-only failure" usually means environment drift. The workers' replicas had silently diverged from the primary's schema.
- Two doctrines for two kinds of dependency: load-bearing infrastructure (janus, the kernel) fails fast and loud; pure acceleration (AST daemon, warm cache) falls back silently to an authoritative local path.
- Replicate before you believe. The 32% claim was challenged, rerun end-to-end, and landed at 30.4% on the second run — the target held.
Related pages: Running the test suite · Free-Threaded Prolog — PRODUCTION
Wave 2 (2026-07-21): the teardowns were the tax, not the connections
A follow-up profiling pass ("34 tests in 30s — why?") explicitly WITHOUT running the whole suite. Connection pooling was the suspect and was exonerated: the session-scoped Neo4j driver (pool 16) is correct; the fixed ~3.2s per-invocation cost is infra preflight. The real tax was per-test database teardown:
- Label-less property sweeps cannot use any index. Neo4j property
indexes require a label, so
MATCH (n) WHERE n.test_id = $x DETACH DELETEfull-scans the node store — 803,688 nodes (~260ms) on the primary, 230k–733k on workers — once per test, ~500 times pertests/knowledge_graph/run. Fix: enumerate the labels the test actually writes in an indexedCALL () { MATCH (n:Label) WHERE ... UNION ALL ... }sweep (~6ms), and for big labels (Session ~260k) use an indexed seek (session_id STARTS WITH, RANGE index). Census of the 10 worst offenders committed (d1c6733a), e.g.test_real_neo4j_knowledge19.04s → 7.92s. - Deferred session-end cleanup (Option 1).
tests/knowledge_graph/'s autouse cleanup no longer sweeps per test — test_ids accumulate in a session registry and ONE session-end sweep deletes them in 200-id chunks (9c5cc9d3). Consequence learned the hard way: entity-linking seeds must be test-unique down to the leaf name (a genericfunc_afrom an unswept sibling made a folded token spuriously ambiguous — caught by the 1872-test directory run, fixed in the same commit). - Memgraph index creation scans the whole vertex store — even for an
empty label (2,514ms measured per
CREATE INDEX). The adapter suite's per-test unique chunk labels each paid it. Fix (9872bd70): ONE session-scoped worker-slot label (TestChunk<slot>), isolation by test_id-prefixed ids: 198.34s → 77.3s (−61%). Bonus find: a real Memgraph consistency defect — chunks physically deleted under a shared HNSW vector index surface as "Returning a deleted object" for >10s — so the suite never deletes under the shared index mid-session. - Deployed infra change:
storage.access_timeout_sec1s → 60s on both orchgraph data instances (runtime + persistent units + the rebuild provisioning template), from the 106-agent graph-DB research run — see Graph DB best practices.
Same session also drove the isolation audit 76 → 0 (ten SUT env=
injection seams replacing test-side os.environ mutation, plus a principled
gate-ok / file-level waiver system in scripts/test_isolation_audit.py).
Open defect (backlogged, HIGH): a full tests/knowledge_graph/ pytest run
hangs at interpreter exit — grpc aio's shutdown_grpc_aio asserts mid-suite
and leaves non-daemon event_engine threads; test_server.py alone exits
clean.