Orchestrata Ultimate / Specs / 100-logging-exception-handling
100-logging-exception-handling: Global Logging and Exception Handling
This specification defines project-wide standards for structured logging, exception handling, and observability across the orchestrata-ultimate system. It establishes consistent patterns for error management, logging contexts, metrics collection, and distributed tracing.
At a glance
| Item | Value |
|---|---|
| Spec directory | specs/100-logging-exception-handling/ |
| Status line in the spec | Draft |
| Requirement IDs defined | 104 |
With a @traces citation in src/ |
0 (0.0%) |
With a @traces citation in tests/ |
0 (0.0%) |
| Tracked files | 6 |
| RTM page | 100-logging-exception-handling |
Reading this spec
This spec sets project-wide standards for structured logging, exception handling and observability across orchestrata-ultimate. It aims at one consistent way to manage errors, carry logging context, collect metrics and trace requests across components and agents, so that logs are machine-readable, production problems are debuggable, performance can be monitored and alerted on, and an audit trail exists. It also separates operational concerns from business logic.
The approach has four parts: structlog with JSON output for structured logging, a hierarchical exception class tree, context propagation through thread-local and async context variables, and observability integration. The functional requirements run from FR-001 to FR-010: the structured logging framework, the exception hierarchy, distributed tracing, metrics collection, error handling patterns, log context propagation, configuration management, performance requirements, security and compliance, and integration requirements. Data models define the log entry schema, the error response schema and the exception hierarchy.
The 104 requirement IDs (REQ-100-NNN) state the rules. Every log entry conforms to a LogEntry JSON Schema whose required fields are timestamp, level, logger, event and component. Log levels are configurable through an environment variable, and the metrics port through METRICS_PORT. Trace context propagates across component boundaries, counters cover request counts and error rates, and a circuit breaker has configurable failure thresholds and reset timeouts. Request-scoped context appears automatically in log entries. Every error belongs to a category (AUTH, AUTHZ, VAL and others) and carries a code from that category's numeric range, and specific conditions such as resource conflict and failed trace propagation have their own codes. Unexpected exceptions log at ERROR and expected ones at WARNING. Audit logging covers security-sensitive operations with user context in immutable, tamper-evident logs, and observability data is available on dashboards within 30 seconds.
The spec's status line reads Draft, and no code module cites it. The requirements traceability matrix lists every ID. It tracks 6 files. No src/ symbol cites any of the 104 requirements, so measured trace coverage is 0.0%, and in tests/, 0 requirements are cited by a test-side @traces. All 104 requirements have no citing symbol; untraced means no @traces names the ID, and the behaviour may still exist in code that was never annotated.
Requirements
Checkbox is the state recorded in the requirements checklist; Traced by is the count of src/ symbols whose @traces names the ID.
| ID | Done | Requirement | Traced by |
|---|---|---|---|
REQ-100-001 |
- | All log entries MUST conform to the LogEntry JSON Schema defined below, whose required fields are timestamp, level, logger, event, and component. |
none |
REQ-100-002 |
- | All error responses MUST conform to the ErrorResponse JSON Schema defined below, whose required fields are error, message, and timestamp. |
none |
REQ-100-003 |
- | The system MUST provide a structured logging framework that outputs JSON-formatted log entries with consistent field names and types. | none |
REQ-100-004 |
- | All log entries SHALL include timestamp, level, logger, event, and component fields | none |
REQ-100-005 |
- | Log entries SHALL be able to include optional context fields (request_id, user_id, trace_id, etc.) | none |
REQ-100-006 |
- | Log format SHALL be configurable as JSON (production) or console (development) | none |
REQ-100-007 |
- | Log levels SHALL be configurable via environment variable | none |
REQ-100-008 |
- | The system MUST implement a hierarchical exception classification system with base and domain-specific exception classes. | none |
REQ-100-009 |
- | A base exception class UltimateBaseError carrying a context dictionary SHALL be provided |
none |
REQ-100-010 |
- | Domain exception categories (ConfigurationError, ValidationError, etc.) SHALL be provided | none |
REQ-100-011 |
- | Specialized exceptions (NotFoundError, TimeoutError, etc.) SHALL be provided | none |
REQ-100-012 |
- | All exceptions SHALL be convertible to structured dictionary format | none |
REQ-100-013 |
- | The system MUST support distributed tracing across component boundaries with trace context propagation. | none |
REQ-100-014 |
- | Trace context SHALL be propagated via headers in HTTP requests and async context | none |
REQ-100-015 |
- | Spans SHALL be created for major operations with configurable sampling | none |
REQ-100-016 |
- | Span attributes SHALL include component, operation, and resource identifiers | none |
REQ-100-017 |
- | Traces SHALL be correlated with logs via the trace_id field | none |
REQ-100-018 |
- | The system MUST collect and expose operational metrics in Prometheus format. | none |
REQ-100-019 |
- | Counter metrics SHALL be provided for request counts and error rates | none |
REQ-100-020 |
- | Histogram metrics SHALL be provided for request durations with configurable buckets | none |
REQ-100-021 |
- | Gauge metrics SHALL be provided for resource usage and active requests | none |
REQ-100-022 |
- | Metrics SHALL be exposed at the /metrics endpoint with proper labeling |
none |
REQ-100-023 |
- | The system MUST implement standard error handling patterns including retry with exponential backoff and circuit breaker. | none |
REQ-100-024 |
- | The retry mechanism SHALL support configurable attempts, delays, and backoff factor | none |
REQ-100-025 |
- | The circuit breaker SHALL support configurable failure thresholds and reset timeouts | none |
REQ-100-026 |
- | A graceful degradation decorator SHALL provide fallback behavior | none |
REQ-100-027 |
- | All of these patterns SHALL support both sync and async operations | none |
REQ-100-028 |
- | The system MUST automatically propagate log context (request_id, user_id, etc.) across async/thread boundaries. | none |
REQ-100-029 |
- | Context SHALL be propagated via thread-local storage for sync operations | none |
REQ-100-030 |
- | Context SHALL be propagated via contextvars for async operations | none |
REQ-100-031 |
- | Context SHALL be automatically included in all log entries within request scope | none |
REQ-100-032 |
- | Context SHALL be manually extensible with additional fields | none |
REQ-100-033 |
- | The system MUST configure logging, tracing, and metrics via environment variables. | none |
REQ-100-034 |
- | Log level SHALL be configurable via the LOG_LEVEL environment variable |
none |
REQ-100-035 |
- | Log format SHALL be configurable via the LOG_FORMAT environment variable |
none |
REQ-100-036 |
- | Tracing SHALL be enabled/disabled via the TRACING_ENABLED environment variable |
none |
REQ-100-037 |
- | Metrics port SHALL be configurable via the METRICS_PORT environment variable |
none |
REQ-100-101 |
- | The system MUST meet performance benchmarks for logging, tracing, and metrics operations. | none |
REQ-100-102 |
- | Logging throughput SHALL be ≥10,000 logs/sec per component | none |
REQ-100-103 |
- | Span creation latency SHALL be ≤100μs per span | none |
REQ-100-104 |
- | Metric collection latency SHALL be ≤10ms per metric update | none |
REQ-100-105 |
- | Error handling overhead SHALL be ≤5ms per error | none |
REQ-100-106 |
- | The system MUST implement security and compliance requirements for observability data. | none |
REQ-100-107 |
- | No PII SHALL be logged without explicit consent | none |
REQ-100-108 |
- | Log data SHALL be encrypted in transit and at rest | none |
REQ-100-109 |
- | Access controls SHALL be enforced for log data and metrics | none |
REQ-100-110 |
- | Access to audit logs SHALL itself be audit-logged | none |
REQ-100-038 |
- | The system MUST integrate with external observability services. | none |
REQ-100-039 |
- | Logs SHALL be deliverable to a centralized aggregation service (Loki, ELK, etc.) | none |
REQ-100-040 |
- | Traces SHALL be exportable to a tracing backend (Jaeger, Tempo, etc.) | none |
REQ-100-041 |
- | Metrics SHALL be scrapable by Prometheus-compatible systems | none |
REQ-100-042 |
- | Health checks SHALL be exposable at the /health endpoint |
none |
REQ-100-043 |
- | Structured logs SHALL satisfy the developer-debugging criteria below — component, request_id and user context on every log; filtering by severity, component and time range; stack traces and relevant state on error logs; correlation IDs connecting related entries across services; and log retention of 30 days minimum. | none |
REQ-100-044 |
- | Health monitoring SHALL satisfy the system-administrator criteria below — key metrics exposed via the Prometheus endpoint; alerts configured for critical failures and performance degradation; dashboards showing system health and performance trends; capacity-planning metrics (memory, CPU, disk, network); and SLA/SLO tracking with error budgets. | none |
REQ-100-045 |
- | Audit logging SHALL satisfy the security-auditor criteria below — all security-sensitive operations logged with user context; audit logs immutable and tamper-evident; before/after state recorded for mutations; access-control checks logged at DEBUG level; and audit-log retention of 90 days minimum. | none |
REQ-100-046 |
- | Performance analysis SHALL satisfy the performance-engineer criteria below — distributed tracing with OpenTelemetry across all components; trace sampling configurable based on load; span durations and metadata for all major operations; performance metrics (latency, throughput, error rates); and correlation between traces, logs and metrics. | none |
REQ-100-047 |
- | The error-handling surface SHALL satisfy the developer criteria below — a clear exception hierarchy with proper inheritance; context carried on every exception; error-recovery patterns (retry, fallback, circuit breaker); graceful degradation when dependencies fail; and comprehensive error documentation. | none |
REQ-100-048 |
- | All log entries MUST include the fields listed below — timestamp, level, logger, event, component, request_id, and session_id (where applicable): |
none |
REQ-100-049 |
- | Error spans MUST include error.type, error.message, and error.stacktrace: |
none |
REQ-100-050 |
- | The system MUST expose the metrics enumerated below — requests_total, request_duration_seconds, active_requests, errors_total, memory_usage_bytes, and business_events_total — each with the stated metric type and labels. |
none |
REQ-100-051 |
- | MUST use structlog for all application logging |
none |
REQ-100-052 |
- | MUST output JSON format in production environments | none |
REQ-100-053 |
- | MUST include correlation IDs in all log entries | none |
REQ-100-054 |
- | MUST configure log levels via environment variable LOG_LEVEL |
none |
REQ-100-055 |
- | MUST use exception hierarchy defined in this specification | none |
REQ-100-056 |
- | MUST include context dictionary in all custom exceptions | none |
REQ-100-057 |
- | MUST log exceptions at appropriate level (ERROR for unexpected, WARNING for expected) | none |
REQ-100-058 |
- | MUST preserve original exception chain using raise ... from ... |
none |
REQ-100-059 |
- | MUST include component label in all metrics | none |
REQ-100-060 |
- | MUST track request duration for all external-facing operations | none |
REQ-100-061 |
- | MUST propagate trace context across all async/thread boundaries | none |
REQ-100-062 |
- | The system MUST read its observability configuration from the environment variables below, honouring the stated value domains and defaults (METRICS_PORT default 9090; TRACING_SAMPLE_RATE in 0.0-1.0, default 0.1): |
none |
REQ-100-063 |
- | Every error MUST be classified into one of the categories below and carry an error code drawn from that category's code range: AUTH (1000-1099), AUTHZ (1100-1199), VAL (1200-1299), RES (1300-1399), INT (1400-1499), SYS (1500-1599), GOV (1600-1699). | none |
REQ-100-064 |
- | A minimum of 10 error conditions MUST be defined and handled; each condition below MUST be raised on its stated trigger, logged at its stated severity, and carry its stated log context. | none |
REQ-100-065 |
- | The system MUST handle ERR-001: Authentication Failed (AUTH-1001) |
none |
REQ-100-066 |
- | The system MUST handle ERR-002: Rate Limit Exceeded (AUTHZ-1101) |
none |
REQ-100-067 |
- | The system MUST handle ERR-003: Invalid Input Validation (VAL-1201) |
none |
REQ-100-068 |
- | The system MUST handle ERR-004: Resource Not Found (RES-1301) |
none |
REQ-100-069 |
- | The system MUST handle ERR-005: Resource Conflict (RES-1302) |
none |
REQ-100-070 |
- | The system MUST handle ERR-006: External Service Timeout (INT-1401) |
none |
REQ-100-071 |
- | The system MUST handle ERR-007: External Service Error (INT-1402) |
none |
REQ-100-072 |
- | The system MUST handle ERR-008: Internal System Error (SYS-1501) |
none |
REQ-100-073 |
- | The system MUST handle ERR-009: Configuration Error (SYS-1502) |
none |
REQ-100-074 |
- | The system MUST handle ERR-010: Logging Infrastructure Unavailable (INT-1403) |
none |
REQ-100-075 |
- | The system MUST handle ERR-011: Trace Context Propagation Failed (SYS-1503) |
none |
REQ-100-076 |
- | The system MUST handle ERR-012: Metrics Collection Overload (SYS-1504) |
none |
REQ-100-077 |
- | MUST log all errors with appropriate severity level | none |
REQ-100-078 |
- | MUST include error context for debugging | none |
REQ-100-079 |
- | MUST map exceptions to error categories | none |
REQ-100-080 |
- | MUST provide human-readable error messages | none |
REQ-100-081 |
- | Observability data MUST be used for proactive alerting and monitoring, covering the alerts and thresholds below: | none |
REQ-100-082 |
- | All three pillars of observability (logs, metrics, traces) MUST be correlated by the mechanisms below: | none |
REQ-100-111 |
- | Log completeness: ≥99% of operations produce at least one log entry | none |
REQ-100-112 |
- | Metric freshness: Metrics updated at least every 15 seconds | none |
REQ-100-113 |
- | Trace sampling: ≥10% of requests sampled for traces in production | none |
REQ-100-114 |
- | Alert coverage: All critical failure modes have corresponding alerts | none |
REQ-100-115 |
- | Dashboard latency: Observability data available within 30 seconds of generation | none |
REQ-100-083 |
- | The system MUST expose GET /api/v1/logging/config returning the current logging configuration in the shape below, whose required fields are level, format, and component. |
none |
REQ-100-084 |
- | All HTTP 4xx/5xx error responses MUST follow the contract below, whose required fields are error, message, and timestamp: |
none |
REQ-100-085 |
- | The system MUST expose GET /metrics returning metrics in Prometheus exposition text format. |
none |
REQ-100-086 |
- | The system MUST expose GET /health returning component health status in the shape below, whose required fields are status (one of healthy, degraded, unhealthy) and timestamp. |
none |
REQ-100-087 |
- | MUST validate error responses against schema in test suites | none |
REQ-100-088 |
- | MUST document all logging configuration parameters | none |
REQ-100-089 |
- | The test suite MUST cover the unit-testing areas below: logging configuration, exception hierarchy, metrics collection, and tracing context. | none |
Code that traces this spec
No src/ symbol cites a requirement of this spec.
Checklists
checklists/README.md
Logging and Exception Handling Checklists
Overview
This directory contains compliance checklists for the Global Logging and Exception Handling specification (SPEC-100). These checklists ensure that all components of the orchestrata-ultimate system implement consistent logging, exception handling, and observability patterns.
Checklist Files
| File | Purpose | Status |
|---|---|---|
constitutional.md |
Compliance with Orchestrata Constitution articles related to observability and error handling | Draft |
requirements.md |
Functional and non-functional requirements verification | Draft |
testing.md |
Test scenarios and verification procedures | Draft |
Usage
- During Development: Developers should reference these checklists when implementing new components or modifying existing ones
- Code Review: Reviewers should use these checklists to ensure compliance
- QA Verification: QA engineers should verify implementation against testing checklist
- Audit: Security and compliance teams should review against constitutional checklist
Checklist Status Legend
- ✅ Complete: All items verified and passing
- 🔄 In Progress: Items being actively worked on
- ⏸️ Blocked: Items blocked by dependencies
- ❌ Failed: Items that failed verification
- 📋 Pending: Items not yet started
Quick Start
For new component implementation:
- Start with
requirements.mdto understand what needs to be implemented - Refer to
constitutional.mdto ensure compliance with governance policies - Use
testing.mdto create test cases for your implementation - Update checklist status as you complete items
Updates
These checklists should be updated when:
- SPEC-100 specification is updated
- New compliance requirements are identified
- Implementation patterns evolve
- Tools or libraries change
Related Specifications
- SPEC-097: Testing Standards
- SPEC-098: API Standards
- SPEC-099: Security Auth Framework
- SPEC-001: Ultimate Architecture
Contact
For questions or updates to these checklists, contact the specification author (Mohamed).
checklists/constitutional.md
Logging and Exception Handling Constitutional Compliance Checklist
Spec: 100-logging-exception-handling
Component: System-wide (all components)
Status: Specification Phase
Overview
This checklist ensures that logging and exception handling implementation complies with all 11 articles of the Orchestrata Constitution. Each article includes specific compliance requirements and verification steps for observability and error management.
Total Compliance Items: 180+ checkboxes
Article I: Separation of Concerns
Principle: Each component has a single, well-defined responsibility
Compliance Requirements
- [ ] Logging implementation is separate from business logic
- [ ] Exception handling is separate from normal control flow
- [ ] Metrics collection is separate from operational code
- [ ] Tracing implementation is separate from application logic
- [ ] Audit logging is separate from application logging
- [ ] Each logging component has clear responsibility boundaries
- [ ] Logging framework does NOT contain business rules
- [ ] Exception hierarchy follows single responsibility principle
- [ ] Error recovery logic is isolated in dedicated modules
- [ ] Observability concerns are separated via cross-cutting concerns
Implementation Verification
- [ ]
structlogconfiguration is in dedicated module (logging_config.py) - [ ] Exception classes follow single responsibility hierarchy
- [ ] Metrics collection uses decorators or middleware patterns
- [ ] Distributed tracing uses OpenTelemetry instrumentation
- [ ] Error recovery patterns (retry, circuit breaker) are in dedicated modules
- [ ] Audit logging uses separate logger instance
- [ ] Log formatting is configurable without code changes
- [ ] Log transport (files, network) is pluggable
- [ ] Performance monitoring does not impact business logic performance
- [ ] Code review validates separation of concerns
Article II: Prolog as Source of Truth
Principle: All governance rules, ownership, and policies are defined in Prolog
Compliance Requirements
- [ ] Log retention policies defined in Prolog
- [ ] Data classification for logging defined in Prolog
- [ ] Access control for audit logs defined in Prolog
- [ ] Alerting thresholds defined in Prolog where possible
- [ ] Error classification rules defined in Prolog
- [ ] Compliance requirements for logging defined in Prolog
- [ ] Data anonymization rules for PII defined in Prolog
- [ ] Security logging requirements defined in Prolog
- [ ] Audit trail requirements defined in Prolog
- [ ] Log aggregation policies defined in Prolog
Implementation Verification
- [ ] Prolog rules exist for log retention periods
- [ ] Prolog rules classify data sensitivity for logging
- [ ] Prolog rules define who can access audit logs
- [ ] Alert thresholds queryable from Prolog engine
- [ ] Error categorization uses Prolog classification
- [ ] GDPR/Privacy compliance rules in Prolog
- [ ] PII detection and redaction rules in Prolog
- [ ] Security event logging rules in Prolog
- [ ] Audit requirements queryable at runtime
- [ ] Integration tests verify Prolog rule application
Article III: Volk Autonomy with Orchestration
Principle: Volks operate autonomously but coordinate through the kernel
Compliance Requirements
- [ ] Each Volk has its own logger instance
- [ ] Volk logging includes Volk identifier in context
- [ ] Volk exceptions propagate to kernel for handling
- [ ] Volk metrics are collected and aggregated
- [ ] Volk traces are part of distributed trace
- [ ] Volk error recovery is autonomous when possible
- [ ] Volk logging configuration inherits from system
- [ ] Volk exceptions are translated to CXP error packets
- [ ] Volk performance metrics feed into orchestration decisions
- [ ] Volk health checks include logging subsystem status
Implementation Verification
- [ ]
Volkbase class includes logger property - [ ] All Volk log entries include
volk_idcontext - [ ] Volk exceptions caught and converted to CXP errors
- [ ] Volk metrics exported with
volk_idlabel - [ ] Volk spans include
volk.attribute prefix - [ ] Volk circuit breakers operate independently
- [ ] Volk logging inherits from kernel configuration
- [ ] Volk error handling follows autonomy principles
- [ ] Volk health checks verify logging connectivity
- [ ] Integration tests validate Volk autonomy
Article IV: CXP as Universal Protocol
Principle: All communication between components uses CXP protocol
Compliance Requirements
- [ ] Log aggregation uses CXP for transport
- [ ] Error reporting uses CXP error packets
- [ ] Metrics collection uses CXP where appropriate
- [ ] Trace context propagated via CXP headers
- [ ] Audit events transmitted via CXP
- [ ] Alert notifications use CXP events
- [ ] Log query interface uses CXP
- [ ] Exception details included in CXP error responses
- [ ] Performance data included in CXP metadata
- [ ] Health check responses include logging status
Implementation Verification
- [ ] CXP packets include
trace_idheader - [ ] CXP error responses include structured error details
- [ ] Log events can be sent via CXP transport
- [ ] Metrics exposed via CXP query interface
- [ ] Trace context extracted from CXP headers
- [ ] Audit events defined as CXP message types
- [ ] Alerts delivered as CXP notifications
- [ ] Log query API uses CXP request/response
- [ ] Exception chaining preserved in CXP errors
- [ ] Integration tests verify CXP observability features
Article V: Multi-Model Architecture
Principle: System supports multiple AI models with flexible routing
Compliance Requirements
- [ ] Model invocation errors logged with model context
- [ ] Model performance metrics tracked per model
- [ ] Model selection errors include model details
- [ ] Model fallback errors logged appropriately
- [ ] Model cost tracking includes error costs
- [ ] Model-specific exceptions defined
- [ ] Model health checks include error rates
- [ ] Model circuit breakers track model failures
- [ ] Model timeouts logged with duration
- [ ] Model quota errors logged for billing
Implementation Verification
- [ ]
ModelErrorexception class exists - [ ] Model metrics include
model_idlabel - [ ] Model selection logs include candidates and rationale
- [ ] Model fallback logic logs attempts and results
- [ ] Model cost tracking includes failed request costs
- [ ] Model health checks consider error patterns
- [ ] Model circuit breakers track per-model state
- [ ] Model timeout logs include model and duration
- [ ] Model quota errors include detailed context
- [ ] Integration tests verify model error handling
Article VI: Proactive Governance (PAM++)
Principle: Governance policies proactively prevent issues
Compliance Requirements
- [ ] Logging policies prevent information leakage
- [ ] Exception handling prevents security breaches
- [ ] Metrics expose governance compliance
- [ ] Tracing verifies policy enforcement
- [ ] Audit trails prove governance compliance
- [ ] Error handling follows governance policies
- [ ] Performance monitoring detects policy violations
- [ ] Alerting notifies of governance issues
- [ ] Log analysis detects policy patterns
- [ ] Compliance reports generated from logs
Implementation Verification
- [ ] PII detection in logs prevents data leakage
- [ ] Exception handling prevents privilege escalation
- [ ] Metrics track policy decision counts
- [ ] Traces show policy evaluation path
- [ ] Audit logs contain policy decision context
- [ ] Error recovery respects governance constraints
- [ ] Performance metrics detect policy overhead
- [ ] Alerts fire on governance violations
- [ ] Log analysis tools detect anomalous patterns
- [ ] Compliance reports generated from structured logs
Article VII: Immutable Audit Trail
Principle: All system actions create immutable audit records
Compliance Requirements
- [ ] All security events logged immutably
- [ ] All governance decisions logged immutably
- [ ] All data mutations logged with before/after state
- [ ] All access control decisions logged
- [ ] All authentication events logged
- [ ] All configuration changes logged
- [ ] All escalation events logged
- [ ] All policy violations logged
- [ ] All system changes logged
- [ ] Audit logs are tamper-evident
Implementation Verification
- [ ] Security logger configured for immutable output
- [ ] Governance decisions include Prolog query and result
- [ ] Data mutations log old and new values
- [ ] Access control logs include subject, resource, action
- [ ] Authentication logs include success/failure and method
- [ ] Configuration change logs include diff
- [ ] Escalation logs include reason and authority
- [ ] Policy violation logs include detailed context
- [ ] System change logs include risk assessment
- [ ] Audit log integrity verified via checksums
Article VIII: Real-Time Collaboration
Principle: Multiple agents can collaborate in real-time
Compliance Requirements
- [ ] Collaborative errors logged with session context
- [ ] Real-time performance metrics tracked
- [ ] Collaboration traces show interaction patterns
- [ ] Concurrent modification errors handled gracefully
- [ ] Conflict resolution errors logged
- [ ] Session-aware logging includes collaboration context
- [ ] Real-time alerting for collaboration issues
- [ ] Collaboration health metrics exposed
- [ ] Multi-agent error recovery coordinated
- [ ] Collaboration audit trails maintained
Implementation Verification
- [ ] Session ID included in all collaboration logs
- [ ] Real-time metrics track collaboration latency
- [ ] Traces show multi-agent interaction flows
- [ ] Concurrent modification exceptions include conflict details
- [ ] Conflict resolution logs show resolution process
- [ ] Session context propagated across all logs
- [ ] Real-time alerts for collaboration failures
- [ ] Collaboration health checks consider all participants
- [ ] Multi-agent recovery uses distributed coordination
- [ ] Audit trails link collaborative actions
Article IX: Knowledge Graph Integration
Principle: All system knowledge is stored in the knowledge graph
Compliance Requirements
- [ ] Error patterns stored in knowledge graph
- [ ] Log analysis results stored in knowledge graph
- [ ] Exception relationships modeled in graph
- [ ] Performance patterns stored in graph
- [ ] Trace analysis stored in graph
- [ ] Alert history stored in graph
- [ ] Audit trail linked to graph entities
- [ ] Compliance evidence stored in graph
- [ ] Incident response data in graph
- [ ] Root cause analysis in graph
Implementation Verification
- [ ] Error patterns extracted to graph with relationships
- [ ] Log analysis creates graph relationships
- [ ] Exception hierarchy modeled as graph schema
- [ ] Performance patterns create temporal graph edges
- [ ] Trace spans stored as graph nodes with relationships
- [ ] Alert history linked to affected resources
- [ ] Audit entries reference graph entities
- [ ] Compliance evidence linked to requirements
- [ ] Incident response creates investigation graph
- [ ] Root cause analysis creates causal graph
Article X: Progressive Enhancement
Principle: System capabilities enhance progressively based on context
Compliance Requirements
- [ ] Logging verbosity adapts to context
- [ ] Error detail level adapts to user role
- [ ] Metrics granularity adapts to system load
- [ ] Trace sampling adapts to performance needs
- [ ] Alert thresholds adapt to historical patterns
- [ ] Recovery strategies adapt to failure severity
- [ ] Monitoring intensity adapts to system state
- [ ] Reporting detail adapts to audience
- [ ] Analysis depth adapts to priority
- [ ] Visualization adapts to data volume
Implementation Verification
- [ ] Dynamic log level configuration based on context
- [ ] Error detail filtered by user permissions
- [ ] Metrics aggregation level adjusts with load
- [ ] Adaptive trace sampling based on error rate
- [ ] Dynamic alert thresholds based on baselines
- [ ] Recovery strategy selection based on impact
- [ ] Monitoring frequency adjusts with stability
- [ ] Report generation tailors detail to role
- [ ] Analysis depth increases with incident severity
- [ ] Visualization adjusts sampling for large datasets
Article XI: Truthfulness and Verification
Principle: System prioritizes truthfulness and verification
Compliance Requirements
- [ ] Logs are accurate and truthful
- [ ] Error reports are verified before alerting
- [ ] Metrics are validated for accuracy
- [ ] Traces are complete and correct
- [ ] Audit trails are verifiable
- [ ] Exception causes are verified
- [ ] Performance data is validated
- [ ] Compliance evidence is verified
- [ ] Root cause analysis is validated
- [ ] All observability data is trustworthy
Implementation Verification
- [ ] Log integrity checks verify accuracy
- [ ] Error verification prevents false alerts
- [ ] Metric validation checks for anomalies
- [ ] Trace completeness verified across boundaries
- [ ] Audit trail verification includes cryptographic signatures
- [ ] Exception cause analysis verified through debugging
- [ ] Performance data cross-validated with multiple sources
- [ ] Compliance evidence independently verifiable
- [ ] Root cause analysis peer-reviewed
- [ ] Observability data trustworthiness audited regularly
Summary
| Article | Total Items | Completed | Pending | Status |
|---|---|---|---|---|
| I | 20 | 0 | 20 | 📋 |
| II | 20 | 0 | 20 | 📋 |
| III | 20 | 0 | 20 | 📋 |
| IV | 20 | 0 | 20 | 📋 |
| V | 20 | 0 | 20 | 📋 |
| VI | 20 | 0 | 20 | 📋 |
| VII | 20 | 0 | 20 | 📋 |
| VIII | 20 | 0 | 20 | 📋 |
| IX | 20 | 0 | 20 | 📋 |
| X | 20 | 0 | 20 | 📋 |
| XI | 20 | 0 | 20 | 📋 |
| Total | 220 | 0 | 220 | 📋 |
Next Steps
- Review checklist with architecture team
- Assign implementation responsibilities
- Create detailed implementation plan
- Begin with Article I (Separation of Concerns)
- Progress through articles in order
- Regular compliance reviews
- Update checklist as implementation progresses
Last Updated
2026-04-09
checklists/requirements.md
The requirement list above comes from this file; 0 of 0 checkbox items are ticked.
checklists/testing.md
Logging and Exception Handling Testing Checklist
Spec: 100-logging-exception-handling
Component: System-wide (all components)
Status: Specification Phase
Overview
This checklist defines test scenarios and verification procedures for the logging and exception handling implementation. It covers unit tests, integration tests, performance tests, and security tests.
Total Test Scenarios: 200+ checkboxes
Unit Test Scenarios
UT-001: Exception Hierarchy Tests
- [ ] Test
UltimateBaseErrorinstantiation with message and context - [ ] Test
to_dict()method returns correct structure - [ ] Test exception inheritance hierarchy
- [ ] Test exception chaining with
raise ... from ... - [ ] Test all domain exception categories instantiate correctly
- [ ] Test specialized exceptions (NotFoundError, etc.) include appropriate defaults
- [ ] Test exception equality and hashing
- [ ] Test exception serialization/deserialization round-trip
- [ ] Test exception string representation includes context
- [ ] Test exception pickling/unpickling
Test Data:
- Various context dictionaries (empty, nested, with special values)
- Exception messages with special characters
- Chained exception scenarios
- Edge cases (None values, empty strings, large contexts)
Assertions:
- Exception type matches expected
to_dict()returns all expected fields- Chained exceptions preserve cause
- String representation includes message and context
- Pickling preserves all attributes
UT-002: Structured Logging Configuration Tests
- [ ] Test structlog configuration loads correctly
- [ ] Test JSON output format in production mode
- [ ] Test console output format in development mode
- [ ] Test log level filtering via environment variable
- [ ] Test log processors are applied in correct order
- [ ] Test custom log fields are included
- [ ] Test exception formatting in logs
- [ ] Test log context binding and unbinding
- [ ] Test async log handler integration
- [ ] Test log filtering by level and component
Test Data:
- Various log levels (DEBUG, INFO, WARNING, ERROR, CRITICAL)
- Log messages with special characters and formatting
- Exception objects with tracebacks
- Context dictionaries with various data types
- Environment variable configurations
Assertions:
- Log output matches expected format
- Log level filtering works correctly
- Exception tracebacks included in error logs
- Context fields preserved in output
- Async logging doesn't block execution
UT-003: Metrics Collection Tests
- [ ] Test counter increment and value retrieval
- [ ] Test histogram observation and bucket calculation
- [ ] Test gauge set/get operations
- [ ] Test label handling for all metric types
- [ ] Test metric registry registration and lookup
- [ ] Test Prometheus exposition format generation
- [ ] Test metric name validation and sanitization
- [ ] Test metric help text inclusion
- [ ] Test metric timestamp handling
- [ ] Test concurrent metric updates thread safety
Test Data:
- Metric names with valid/invalid characters
- Label values with special characters
- Counter values at boundaries (0, max int, negative)
- Histogram observations across bucket ranges
- Concurrent update scenarios
Assertions:
- Counter values increment correctly
- Histogram buckets contain correct observations
- Gauge values set/retrieve accurately
- Labels correctly distinguish metric series
- Exposition format matches Prometheus spec
- Thread safety maintained under concurrency
UT-004: Tracing Implementation Tests
- [ ] Test span creation and context management
- [ ] Test span attribute setting and retrieval
- [ ] Test span event recording
- [ ] Test span status setting (OK, ERROR)
- [ ] Test trace context propagation
- [ ] Test span parent-child relationships
- [ ] Test sampling decisions based on rate
- [ ] Test trace export in various formats
- [ ] Test span duration measurement accuracy
- [ ] Test trace ID generation uniqueness
Test Data:
- Span names and attributes
- Parent trace contexts
- Sampling rates (0.0, 0.5, 1.0)
- Error conditions for status testing
- Concurrent span creation scenarios
Assertions:
- Spans created with correct metadata
- Attributes preserved across span lifecycle
- Context propagation maintains trace continuity
- Sampling respects configured rate
- Export formats contain all span data
- Trace IDs are sufficiently unique
UT-005: Error Handling Pattern Tests
- [ ] Test retry with exponential backoff logic
- [ ] Test circuit breaker state transitions
- [ ] Test graceful degradation decorator
- [ ] Test timeout handling with async operations
- [ ] Test bulkhead concurrency limiting
- [ ] Test fallback strategy execution
- [ ] Test error classification accuracy
- [ ] Test dead letter queue operations
- [ ] Test error recovery state transitions
- [ ] Test error escalation path triggering
Test Data:
- Operation success/failure patterns
- Timeout durations and configurations
- Concurrency limits and violations
- Various error types for classification
- Recovery state machine inputs
Assertions:
- Retry logic respects max attempts and delays
- Circuit breaker opens/closes at thresholds
- Degradation provides fallback functionality
- Timeouts cancel operations as expected
- Bulkhead prevents resource exhaustion
- Fallback strategies execute when primary fails
- Error classification matches expected categories
- Dead letter queue preserves failed operations
- Recovery states transition correctly
- Escalation triggers when configured
Integration Test Scenarios
IT-001: End-to-End Logging Integration
- [ ] Test log generation across component boundaries
- [ ] Test log context propagation through full request flow
- [ ] Test structured log output in JSON format
- [ ] Test log aggregation to centralized service
- [ ] Test log search and retrieval by various fields
- [ ] Test log retention policy enforcement
- [ ] Test log archiving and restoration
- [ ] Test log analysis query execution
- [ ] Test log visualization dashboard generation
- [ ] Test log-based alert triggering
Test Setup:
- Full application stack with all components
- Centralized log aggregation service (Loki/ELK)
- Log shipping configuration
- Test data generation for various scenarios
Assertions:
- Logs generated at all component boundaries
- Context propagated through entire request flow
- JSON format matches schema
- Logs arrive in aggregation service
- Search returns correct log entries
- Retention policies delete old logs
- Archived logs can be restored
- Analysis queries return correct results
- Dashboards render without errors
- Alerts trigger on configured conditions
IT-002: Distributed Tracing Integration
- [ ] Test trace propagation across service boundaries
- [ ] Test span creation in all major components
- [ ] Test trace sampling across distributed system
- [ ] Test trace export to backend (Jaeger/Tempo)
- [ ] Test trace query and visualization
- [ ] Test trace-based performance analysis
- [ ] Test trace context loss detection and recovery
- [ ] Test trace correlation with logs and metrics
- [ ] Test distributed trace debugging
- [ ] Test trace-based root cause analysis
Test Setup:
- Multi-service application deployment
- Tracing backend configured
- Trace sampling configuration
- Test requests with known execution paths
Assertions:
- Trace context propagated through all services
- Spans created for all major operations
- Sampling rate respected across services
- Traces exported to backend correctly
- Trace queries return complete traces
- Performance analysis identifies bottlenecks
- Context loss detected and logged
- Trace/log/metric correlation works
- Debugging identifies issues in traces
- Root cause analysis identifies correct component
IT-003: Metrics Integration
- [ ] Test metrics collection across all components
- [ ] Test metrics aggregation and summarization
- [ ] Test Prometheus scraping and storage
- [ ] Test metrics-based alerting
- [ ] Test metrics visualization in Grafana
- [ ] Test SLO/SLI calculation from metrics
- [ ] Test capacity planning with historical metrics
- [ ] Test performance regression detection
- [ ] Test anomaly detection from metric patterns
- [ ] Test metric-driven auto-scaling
Test Setup:
- Application with instrumented endpoints
- Prometheus configured for scraping
- Grafana dashboards configured
- Alert manager configured
- Historical metrics data
Assertions:
- Metrics collected from all components
- Aggregation produces correct summaries
- Prometheus stores metrics correctly
- Alerts fire on metric thresholds
- Grafana dashboards show correct data
- SLO/SLI calculations match expectations
- Capacity planning uses accurate metrics
- Regression detection identifies degradations
- Anomaly detection flags unusual patterns
- Auto-scaling triggers based on metrics
IT-004: Error Handling Integration
- [ ] Test error propagation across component boundaries
- [ ] Test circuit breaker integration with external services
- [ ] Test retry logic with real network failures
- [ ] Test graceful degradation under partial failures
- [ ] Test timeout handling with slow dependencies
- [ ] Test bulkhead isolation during dependency failures
- [ ] Test fallback strategies in production scenarios
- [ ] Test error classification in complex workflows
- [ ] Test dead letter queue integration with monitoring
- [ ] Test error escalation to human operators
Test Setup:
- Application with external dependencies
- Failure injection capabilities
- Monitoring and alerting configured
- Human operator notification channels
- Complex workflow test scenarios
Assertions:
- Errors propagate correctly through system
- Circuit breakers protect during dependency failures
- Retry logic handles transient network issues
- Degradation maintains partial functionality
- Timeouts prevent hung operations
- Bulkheads contain failures to affected components
- Fallback strategies provide acceptable service
- Error classification enables automated handling
- Dead letter queue captures unprocessable items
- Escalation notifies humans when needed
IT-005: Security and Audit Integration
- [ ] Test audit log generation for security events
- [ ] Test audit log integrity verification
- [ ] Test access control for audit data
- [ ] Test PII detection and redaction in logs
- [ ] Test security event correlation
- [ ] Test compliance evidence collection
- [ ] Test forensic investigation support
- [ ] Test regulatory requirement validation
- [ ] Test security monitoring integration
- [ ] Test incident response automation
Test Setup:
- Application with authentication/authorization
- Security event generation capabilities
- Audit log storage with integrity protection
- Compliance requirement definitions
- Forensic analysis tools
Assertions:
- Audit logs generated for all security events
- Log integrity can be verified cryptographically
- Access control prevents unauthorized audit access
- PII properly redacted in logs
- Security events correlated across systems
- Compliance evidence collected and organized
- Forensic investigations supported by logs
- Regulatory requirements validated against logs
- Security monitoring detects anomalies
- Incident response automated where possible
Performance Test Scenarios
PT-001: Logging Performance Tests
- [ ] Test logging throughput under high load
- [ ] Test logging latency impact on application
- [ ] Test memory usage of log buffers
- [ ] Test disk I/O impact of log writing
- [ ] Test network I/O impact of log shipping
- [ ] Test log compression performance
- [ ] Test log rotation performance
- [ ] Test log query performance with large datasets
- [ ] Test log aggregation scalability
- [ ] Test log analysis performance
Test Methodology:
- Load generation with varying request rates
- Resource monitoring during tests
- Latency measurement with/without logging
- Throughput measurement at saturation points
- Scalability testing with increasing load
Acceptance Criteria:
- Logging overhead < 5% of request time at P95
- Memory usage bounded under sustained load
- Disk I/O doesn't saturate storage
- Network I/O for logs < 10% of available bandwidth
- Compression reduces size by > 50% with < 5% CPU
- Rotation completes within 1 second
- Query response < 100ms for 1M log entries
- Aggregation scales linearly to 10K events/second
- Analysis completes within business requirements
PT-002: Tracing Performance Tests
- [ ] Test tracing overhead for sampled traces
- [ ] Test tracing overhead for unsampled traces
- [ ] Test trace context propagation performance
- [ ] Test span creation and closure performance
- [ ] Test trace export performance
- [ ] Test trace storage and retrieval performance
- [ ] Test trace analysis performance
- [ ] Test distributed trace assembly performance
- [ ] Test trace sampling decision performance
- [ ] Test trace visualization rendering performance
Test Methodology:
- Measurement with varying sampling rates
- Comparison with tracing disabled
- Distributed system performance measurement
- Export pipeline performance testing
- Storage system load testing
Acceptance Criteria:
- Tracing overhead < 5% for sampled traces at P95
- Tracing overhead < 1% for unsampled traces
- Context propagation adds < 1ms per hop
- Span creation/closure < 100 microseconds
- Export keeps up with trace generation
- Storage supports expected trace volume
- Analysis completes within interactive timeframes
- Distributed assembly < 100ms for 100-span traces
- Sampling decision < 10 microseconds
- Visualization renders within 2 seconds
PT-003: Metrics Performance Tests
- [ ] Test metrics collection overhead
- [ ] Test metrics aggregation performance
- [ ] Test metrics query performance
- [ ] Test metrics storage performance
- [ ] Test metrics export performance
- [ ] Test alert evaluation performance
- [ ] Test dashboard rendering performance
- [ ] Test metric rollup performance
- [ ] Test metric correlation performance
- [ ] Test anomaly detection performance
Test Methodology:
- Measurement with increasing metric cardinality
- Query performance with time range variations
- Storage performance with data volume growth
- Alert evaluation under high alert rule counts
- Dashboard performance with complex queries
Acceptance Criteria:
- Collection overhead < 2% of request time
- Aggregation completes within collection interval
- Query response < 100ms for 1M data points
- Storage supports expected retention period
- Export doesn't impact collection performance
- Alert evaluation < 1 second for 1000 rules
- Dashboard renders within 5 seconds
- Rollup maintains query performance
- Correlation identifies patterns within 10 seconds
- Anomaly detection runs within configured intervals
PT-004: Error Handling Performance Tests
- [ ] Test exception creation and throwing performance
- [ ] Test error recovery logic performance
- [ ] Test circuit breaker performance impact
- [ ] Test retry logic performance
- [ ] Test timeout handling performance
- [ ] Test bulkhead performance impact
- [ ] Test fallback strategy performance
- [ ] Test error classification performance
- [ ] Test dead letter queue performance
- [ ] Test error escalation performance
Test Methodology:
- Performance measurement under normal operation
- Performance measurement during error conditions
- Comparison with error handling disabled
- Load testing with various failure rates
- Stress testing error handling mechanisms
Acceptance Criteria:
- Exception handling < 1ms per exception
- Recovery logic doesn't add significant overhead
- Circuit breaker adds < 1ms to successful calls
- Retry logic efficient for expected failure rates
- Timeout handling adds minimal overhead
- Bulkhead isolation adds < 5% overhead
- Fallback execution comparable to primary
- Classification completes within business logic time
- Dead letter queue operations < 10ms
- Escalation triggers within 1 second of need
Security Test Scenarios
ST-001: Logging Security Tests
- [ ] Test log injection prevention
- [ ] Test log access control enforcement
- [ ] Test log encryption in transit and at rest
- [ ] Test PII detection and redaction
- [ ] Test audit log tamper detection
- [ ] Test log retention policy enforcement
- [ ] Test log integrity verification
- [ ] Test log confidentiality protection
- [ ] Test log availability during attacks
- [ ] Test log forensics capabilities
Test Methodology:
- Injection attempts with malicious payloads
- Access control bypass attempts
- Network sniffing for unencrypted logs
- PII detection accuracy testing
- Tamper attempts and detection verification
- Retention policy verification
- Integrity verification testing
- Confidentiality breach attempts
- Availability under DoS attacks
- Forensic investigation simulation
Acceptance Criteria:
- Log injection prevented (OWASP A1)
- Access control prevents unauthorized access
- Logs encrypted with strong cryptography
- PII redaction effective for all sensitive data
- Tamper detection identifies modifications
- Retention policies consistently enforced
- Integrity verification successful for valid logs
- Confidentiality maintained under expected threats
- Logs available during sustained attacks
- Forensics supports incident investigation
ST-002: Metrics Security Tests
- [ ] Test metrics endpoint access control
- [ ] Test metrics data confidentiality
- [ ] Test metrics integrity protection
- [ ] Test metrics availability protection
- [ ] Test metrics injection prevention
- [ ] Test metrics aggregation security
- [ ] Test alerting system security
- [ ] Test dashboard access control
- [ ] Test metric-based attack detection
- [ ] Test metrics system forensics
Test Methodology:
- Unauthorized access attempts to metrics
- Confidentiality testing of metric data
- Integrity verification of metric streams
- Availability testing under attack
- Injection attempts into metric data
- Aggregation algorithm security analysis
- Alerting system abuse attempts
- Dashboard access control testing
- Attack simulation with metric monitoring
- Forensic analysis of metric data
Acceptance Criteria:
- Metrics endpoint properly authenticated
- Metric data doesn't leak sensitive information
- Metric integrity can be verified
- Metrics available during attacks
- Injection prevented in metric collection
- Aggregation doesn't introduce vulnerabilities
- Alerting system resistant to abuse
- Dashboard access properly controlled
- Attacks detected via metric anomalies
- Forensics supported by metric history
ST-003: Tracing Security Tests
- [ ] Test trace data confidentiality
- [ ] Test trace context injection prevention
- [ ] Test trace access control
- [ ] Test trace data integrity
- [ ] Test trace sampling security
- [ ] Test trace export security
- [ ] Test trace storage security
- [ ] Test trace analysis security
- [ ] Test trace visualization security
- [ ] Test trace-based attack detection
Test Methodology:
- Confidentiality analysis of trace data
- Injection attempts into trace context
- Unauthorized trace access attempts
- Integrity testing of trace data
- Sampling algorithm security analysis
- Export channel security testing
- Storage system security assessment
- Analysis tool security testing
- Visualization access control testing
- Attack detection via trace analysis
Acceptance Criteria:
- Trace data doesn't expose secrets
- Context injection prevented
- Trace access properly controlled
- Trace integrity maintained
- Sampling doesn't introduce bias or vulnerabilities
- Export uses secure channels
- Storage meets security requirements
- Analysis tools don't introduce vulnerabilities
- Visualization access properly controlled
- Attacks detectable in trace patterns
ST-004: Error Handling Security Tests
- [ ] Test error message information leakage
- [ ] Test error recovery security
- [ ] Test circuit breaker security
- [ ] Test retry logic security implications
- [ ] Test timeout handling security
- [ ] Test bulkhead security
- [ ] Test fallback strategy security
- [ ] Test error classification security
- [ ] Test dead letter queue security
- [ ] Test error escalation security
Test Methodology:
- Error message analysis for information leakage
- Recovery process security assessment
- Circuit breaker security implications
- Retry logic security analysis
- Timeout handling security assessment
- Bulkhead security testing
- Fallback strategy security analysis
- Error classification security implications
- Dead letter queue security testing
- Escalation process security assessment
Acceptance Criteria:
- Error messages don't leak sensitive information
- Recovery processes don't introduce vulnerabilities
- Circuit breakers don't enable DoS attacks
- Retry logic doesn't amplify attacks
- Timeouts don't enable timing attacks
- Bulkheads don't introduce side channels
- Fallback strategies maintain security
- Error classification doesn't expose information
- Dead letter queue properly secured
- Escalation maintains security controls
Test Environment Requirements
Hardware Requirements
- Development: 8GB RAM, 4 cores, 100GB disk
- Testing: 16GB RAM, 8 cores, 500GB disk
- Performance: 32GB RAM, 16 cores, 1TB SSD
- Security: Isolated network, dedicated hardware
Software Requirements
- Python 3.11+ with all dependencies
- Docker and Docker Compose for containerized services
- Prometheus, Grafana, Loki/ELK stack
- Jaeger/Tempo for distributed tracing
- Load testing tools (k6, locust, etc.)
- Security testing tools (OWASP ZAP, nmap, etc.)
Data Requirements
- Test datasets covering all scenarios
- Synthetic load generation patterns
- Security test payloads
- Performance baseline measurements
- Compliance test cases
Environment Configuration
- Isolated test environments for each test type
- Clean environment for each test run
- Version-controlled configuration
- Automated environment provisioning
- Monitoring of test environment health
Test Automation Strategy
Continuous Integration
- Unit tests run on every commit
- Integration tests run on pull requests
- Performance tests run nightly
- Security tests run weekly
Test Reporting
- JUnit XML output for test results
- Code coverage reports
- Performance test results with trends
- Security test findings with severity
- Compliance test reports
Test Maintenance
- Test review with code changes
- Test refactoring for maintainability
- Test data versioning
- Test environment documentation
- Test tool updates
Risk Assessment
High Risk Areas
- Performance impact on production
- Security of observability data
- Reliability during failures
- Compliance with regulations
Mitigation Strategies
- Gradual rollout with monitoring
- Security review before production
- Failure mode testing
- Compliance validation
Contingency Plans
- Rollback procedures
- Emergency disable procedures
- Data recovery procedures
- Incident response procedures
Test Schedule
| Test Type | Frequency | Duration | Environment | Owner |
|---|---|---|---|---|
| Unit Tests | On commit | 5 minutes | CI | Mohamed |
| Integration Tests | On PR | 30 minutes | Staging | Mohamed |
| Performance Tests | Nightly | 2 hours | Performance | Mohamed |
| Security Tests | Weekly | 4 hours | Security | Mohamed |
| Compliance Tests | Monthly | 8 hours | Compliance | Mohamed |
| Full Regression | Before release | 1 day | Production-like | Mohamed |
Last Updated
2026-04-09
Other tracked files
specs/100-logging-exception-handling/compliance-audit.md
Full spec text
Verbatim from specs/100-logging-exception-handling/spec.md; headings are pushed down two levels.
SPEC-100: Global Logging and Exception Handling
Metadata
- Spec ID: 100-logging-exception-handling
- Title: Global Logging and Exception Handling - Project-Wide Standards
- Author: Mohamed
- Status: Draft
- Created: 2026-04-09
- Last Updated: 2026-04-09
- Priority: P0
- Version: 1.0.0
Overview
This specification defines project-wide standards for structured logging, exception handling, and observability across the orchestrata-ultimate system. It establishes consistent patterns for error management, logging contexts, metrics collection, and distributed tracing.
What
A unified logging and exception handling framework using structlog for structured logging, custom exception hierarchy, context propagation, and observability integration.
Why
- Consistent error handling and logging across all components
- Structured logs for machine processing and analytics
- Distributed tracing across microservices and agents
- Performance monitoring and alerting
- Debuggability and audit trail compliance
- Separation of operational concerns from business logic
How
- structlog with JSON output for structured logging
- Hierarchical exception classes with proper inheritance
- Context propagation via thread-local and async context vars
- Log aggregation to centralized service (Loki/ELK)
- Metrics collection with Prometheus
- Distributed tracing with OpenTelemetry
Visual Architecture
Class Diagram
Diagram source shown as text: Mermaid could not parse it (Error: Parse error on line 6:).
classDiagram-direction LR
    class AuditAction {
    }
    class AuditStatus {
    }
    <<dataclass>>
    class AuditEvent <<dataclass>> {
        -action: AuditAction
        -timestamp: datetime = field(default_factory=datetime.now)
        -status: AuditStatus = AuditStatus.SUCCESS
        -actor_id: str | None = None
        -actor_type: str = 'user'
        -actor_ip: str | None = None
        -actor_user_agent: str | None = None
        -resource_type: str | None = None
        -resource_id: str | None = None
        -resource_path: str | None = None
        -operation_id: str | None = None
        -operation_name: str | None = None
        -operation_duration_ms: float | None = None
        -before_state: dict[str, Any] | None = None
        -after_state: dict[str, Any] | None = None
        -changes: list[str] | None = None
        -request_id: str | None = None
        -session_id: str | None = None
        -trace_id: str | None = None
        -span_id: str | None = None
        -component: str | None = None
        -severity: str = 'info'
        -details: dict[str, Any] | None = None
        -error_message: str | None = None
        -error_stack: str | None = None
        -event_hash: str | None = None
        -previous_hash: str | None = None
        ---
        +__post_init__()
        +calculate_hash(): str
        #_json_serializer(obj)
        +to_dict(): dict[str, Any]
        +verify_hash(): bool
    }
    class AuditLogger {
        +__init__(component: str | None = None)
        +log_event(event: AuditEvent): str
        +log_action(action: AuditAction | str, status: AuditStatus | str = AuditStatus.SUCCESS, resource_type: str | None = None, resource_id: str | None = None, before_state: dict[str, Any] | None = None, after_state: dict[str, Any] | None = None, actor_id: str | None = None, actor_type: str = 'user', details: dict[str, Any] | None = None, error_message: str | None = None, operation_duration_ms: float | None = None, severity: str | None = None): str
    }
    <<dataclass>>
    class AuditOperation <<dataclass>> {
        -action: AuditAction | str
        -resource_type: str | None = None
        -resource_id: str | None = None
        -before_state: dict[str, Any] | None = None
        -actor_id: str | None = None
        -actor_type: str = 'user'
        -component: str | None = None
        -details: dict[str, Any] | None = None
        ---
        +__enter__()
        +__exit__(exc_type, exc_val, exc_tb)
    }
    <<dataclass>>
    class LoggingContext <<dataclass>> {
        -request_id: str | None = None
        -session_id: str | None = None
        -trace_id: str | None = None
        -span_id: str | None = None
        -user_id: str | None = None
        -user_email: str | None = None
        -user_role: str | None = None
        -component: str | None = None
        -operation: str | None = None
        -extra: dict[str, Any] = field(default_factory=dict)
        -created_at: datetime = field(default_factory=datetime.now)
        ---
        +to_dict(): dict[str, Any]
    }
    class ContextManager {
        {@staticmethod} +get_current_context(): LoggingContext
        {@staticmethod} +set_current_context(context: LoggingContext): None
        {@staticmethod} +clear_context(): None
        {@staticmethod} +update_context(**kwargs): LoggingContext
        {@staticmethod} +create_child_context(**updates): LoggingContext
    }
    class AsyncContext {
        +__init__(**context_updates)
        +async __aenter__(): LoggingContext
        +async __aexit__(exc_type, exc_val, exc_tb)
    }
    class Context {
        +__init__(**context_updates)
        +__enter__(): LoggingContext
        +__exit__(exc_type, exc_val, exc_tb)
    }
    class LogLevel {
    }
    class LogContext {
        +__init__(logger: BoundLogger, **context)
        +__enter__()
        +__exit__(exc_type, exc_val, exc_tb)
    }
    class MetricsConfig {
        +__init__(enabled: bool = True, port: int = 9090, host: str = '0.0.0.0', include_system_metrics: bool = True, system_metrics_interval: float = 30.0)
    }
    class RetryStrategy {
        +__init__(max_retries: int = 3, initial_delay: float = 0.1, max_delay: float = 10.0, backoff_factor: float = 2.0, jitter: float = 0.1)
        +calculate_delay(attempt: int): float
    }
    class CircuitState {
    }
    class CircuitBreaker {
        +__init__(failure_threshold: int = 5, reset_timeout: timedelta = timedelta(seconds=30), half_open_max_requests: int = 3, name: str | None = None)
        {@property} +is_closed(): bool
        {@property} +is_open(): bool
        {@property} +is_half_open(): bool
        +record_success(): None
        +record_failure(): None
        +should_allow_request(): bool
        +async execute(operation: Callable[[], T]): T
    }
    class Bulkhead {
        +__init__(max_concurrent: int = 10, max_queue_size: int = 100, name: str | None = None)
        +async execute(operation: Callable[[], T]): T
    }
    <<dataclass>>
    class TraceInfo <<dataclass>> {
        -spec: str = ''
        -story: str = ''
        -reqs: List[str] = field(default_factory=list)
        -module: str = ''
        -class_name: str = ''
        -method: str = ''
        -file_path: str = ''
        -line_number: int = 0
        ---
        +to_dict(): Dict[str, Any]
    }
    <<dataclass>>
    class Requirement <<dataclass>> {
        -id: str
        -description: str
        -story_id: str = ''
        -spec_id: str = ''
        -priority: str = 'NORMAL'
        -category: str = ''
        ---
    }
    <<dataclass>>
    class UserStory <<dataclass>> {
        -id: str
        -title: str
        -as_a: str = ''
        -i_want: str = ''
        -so_that: str = ''
        -acceptance_criteria: List[str] = field(default_factory=list)
        -requirements: List[Requirement] = field(default_factory=list)
        -spec_id: str = ''
        ---
        +to_dict(): Dict[str, Any]
    }
    <<dataclass>>
    class ValidationReport <<dataclass>> {
        -verified: List[str] = field(default_factory=list)
        -missing: List[str] = field(default_factory=list)
        -orphan: List[str] = field(default_factory=list)
        -duplicates: Dict[str, List[str]] = field(default_factory=dict)
        ---
        {@property} +total_verified(): int
        {@property} +total_missing(): int
        {@property} +total_orphan(): int
        {@property} +coverage_percent(): float
        +to_dict(): Dict[str, Any]
    }
    <<dataclass>>
    class RTMReport <<dataclass>> {
        -entries: List[Dict[str, Any]] = field(default_factory=list)
        -validation: Optional[ValidationReport] = None
        -generated_at: str = ''
        -project: str = ''
        ---
        +to_dict(): Dict[str, Any]
    }
    str <|-- AuditAction
    Enum <|-- AuditAction
    str <|-- AuditStatus
    Enum <|-- AuditStatus
    str <|-- LogLevel
    Enum <|-- LogLevel
    str <|-- CircuitState
    Enum <|-- CircuitState
    AuditEvent *-- AuditAction "1" "action" "1"
    AuditEvent *-- AuditStatus "1" "status" "1"
    UserStory *-- Requirement "1" "requirements" "1"
    RTMReport *-- ValidationReport "1" "validation" "1"
    AuditLogger ..> AuditEvent "log_event(event)"
    ContextManager ..> LoggingContext "get_current_context returns"
    ContextManager ..> LoggingContext "set_current_context(context)"
    ContextManager ..> LoggingContext "update_context returns"
    ContextManager ..> LoggingContext "create_child_context returns"
    AsyncContext ..> LoggingContext "__aenter__ returns"
    Context ..> LoggingContext "__enter__ returns"
    AuditLogger ..> AuditEvent "AuditEvent"
    AuditLogger ..> AuditAction "AuditAction"
    AuditLogger ..> AuditStatus "AuditStatus"
    ContextManager ..> LoggingContext "LoggingContext"
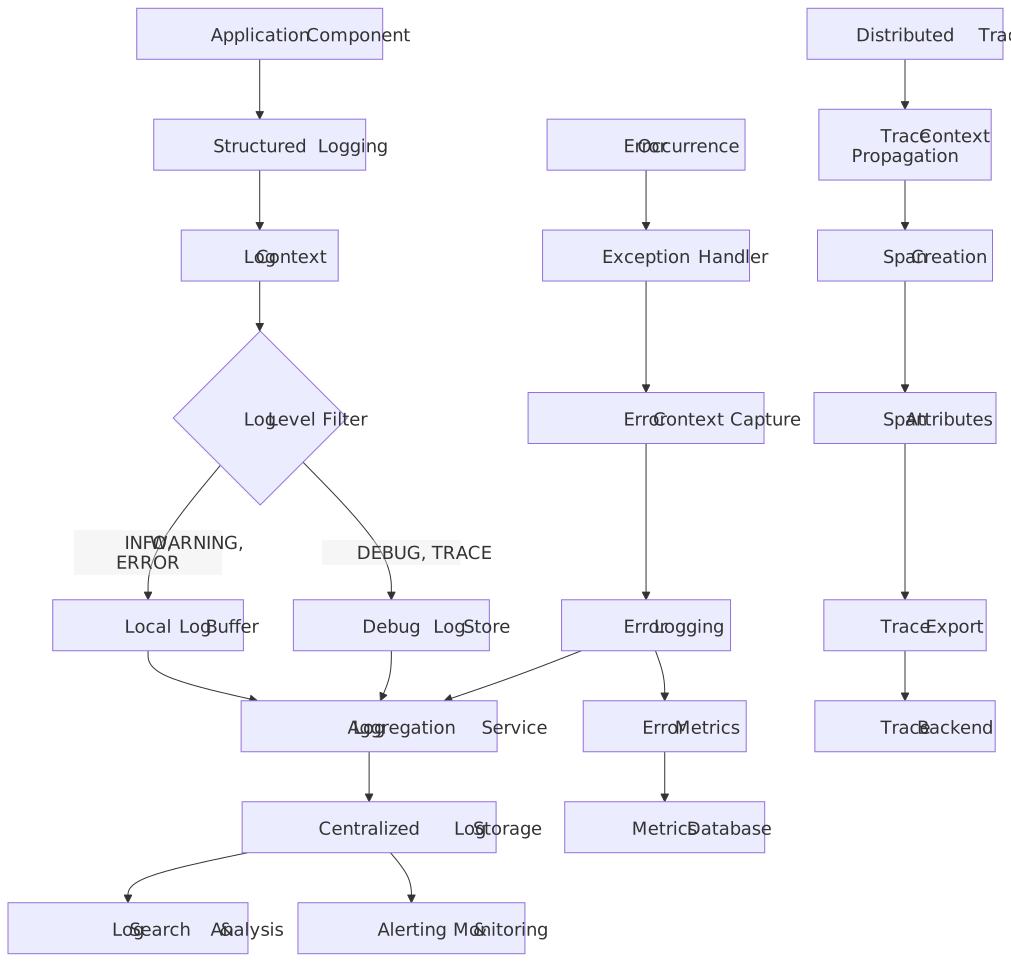
Logging Flow
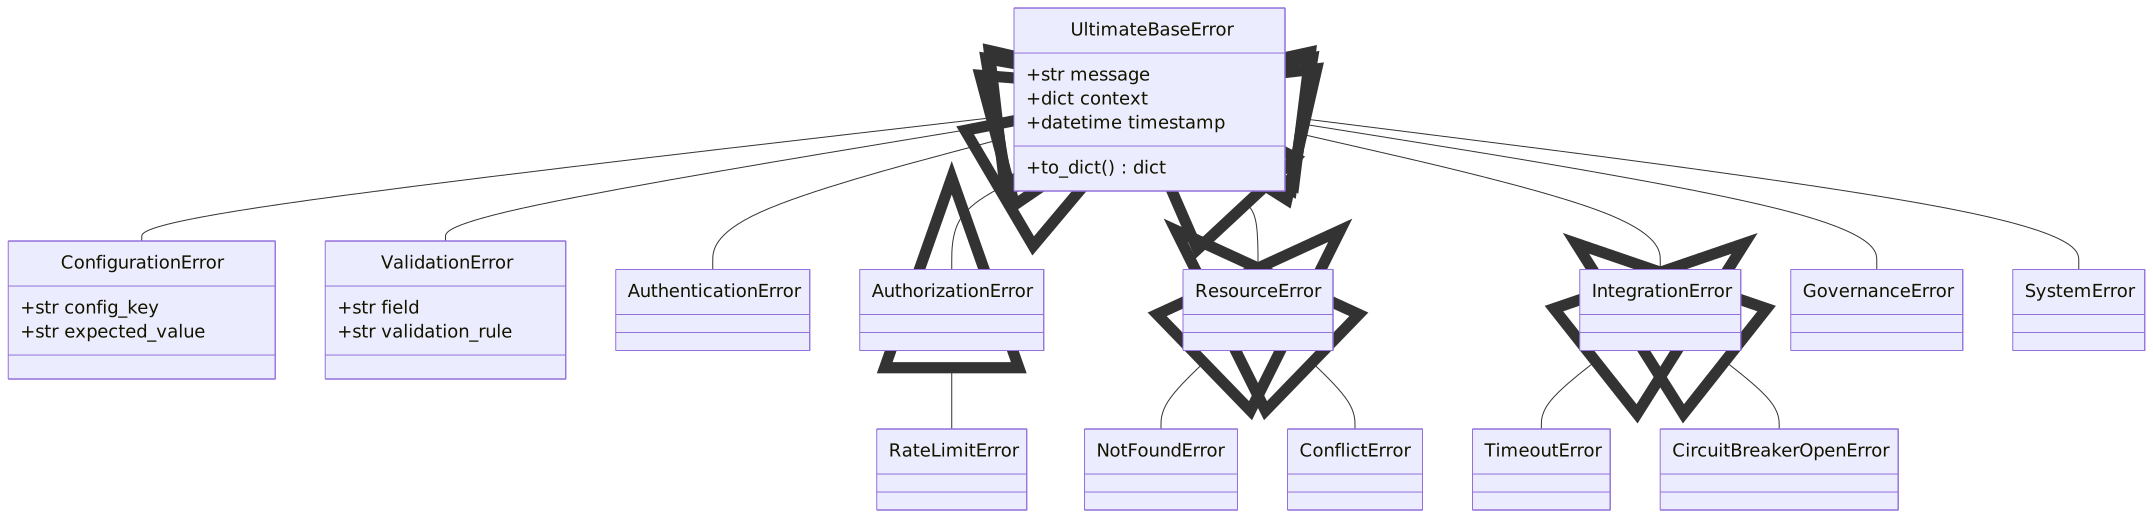
Exception Hierarchy
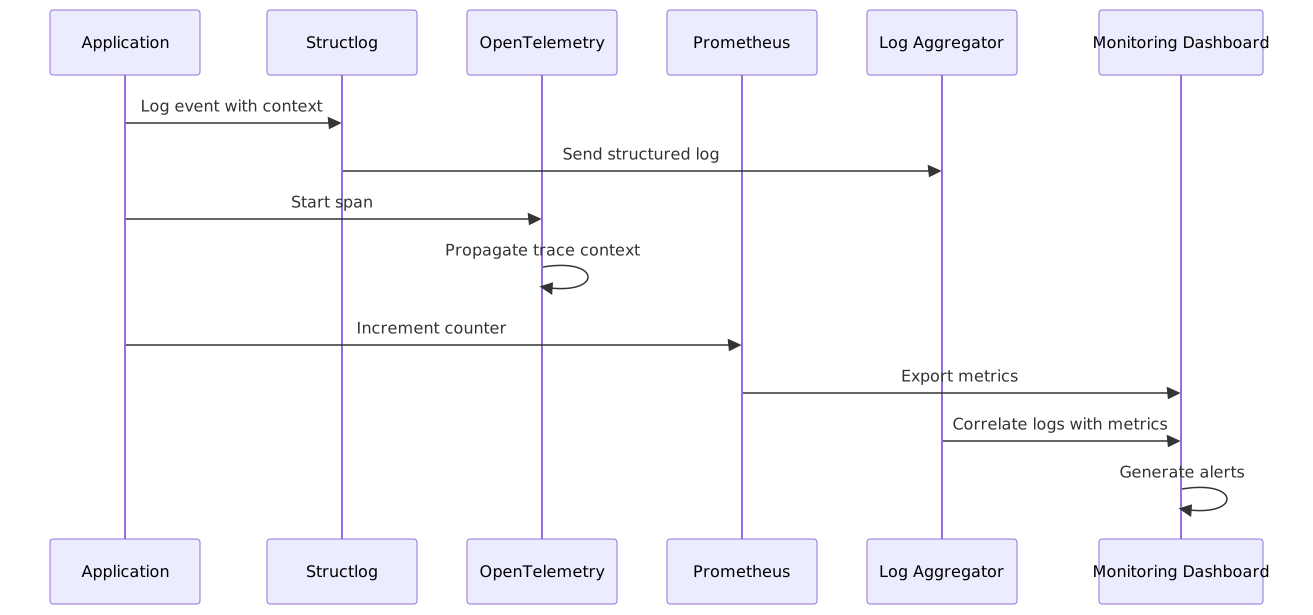
Observability Data Flow
Terminology and Glossary
| Term | Definition |
|---|---|
| Structured Logging | Logging where each log entry is a structured data object (JSON) rather than plain text |
| Log Context | Additional metadata attached to log entries (request ID, user, component, etc.) |
| Exception Hierarchy | Organized exception classes with inheritance relationships for proper error handling |
| Distributed Tracing | Tracking requests across service/component boundaries with unique trace IDs |
| Span | A single operation within a trace with start/end time and metadata |
| Log Aggregation | Collecting logs from multiple sources into a central system for analysis |
| Metrics | Numerical measurements of system behavior over time (counters, gauges, histograms) |
| Alerting | Automated notifications when metrics cross defined thresholds |
| Audit Trail | Immutable record of system actions for compliance and forensic analysis |
Data Models
Log Entry Schema
REQ-100-001: All log entries MUST conform to the LogEntry JSON Schema defined below, whose required fields are timestamp, level, logger, event, and component.
{
  "$schema": "http://json-schema.org/draft/2020-12/schema",
  "title": "LogEntry",
  "type": "object",
  "required": ["timestamp", "level", "logger", "event", "component"],
  "properties": {
    "timestamp": {
      "type": "string",
      "format": "date-time",
      "description": "ISO 8601 timestamp"
    },
    "level": {
      "type": "string",
      "enum": ["TRACE", "DEBUG", "INFO", "WARNING", "ERROR", "CRITICAL"]
    },
    "logger": {
      "type": "string",
      "description": "Logger name (module path)"
    },
    "event": {
      "type": "string",
      "description": "Descriptive event message"
    },
    "component": {
      "type": "string",
      "description": "Component identifier"
    },
    "request_id": {
      "type": "string",
      "description": "Correlation ID for request/operation"
    },
    "session_id": {
      "type": "string",
      "description": "User session identifier"
    },
    "user_id": {
      "type": "string",
      "description": "Authenticated user identifier"
    },
    "trace_id": {
      "type": "string",
      "description": "Distributed trace identifier"
    },
    "span_id": {
      "type": "string",
      "description": "Current span identifier"
    },
    "duration_ms": {
      "type": "number",
      "description": "Operation duration in milliseconds"
    },
    "status": {
      "type": "string",
      "description": "Operation status"
    },
    "error": {
      "type": "object",
      "properties": {
        "type": { "type": "string" },
        "message": { "type": "string" },
        "stacktrace": { "type": "string" }
      }
    }
  }
}
Error Response Schema
REQ-100-002: All error responses MUST conform to the ErrorResponse JSON Schema defined below, whose required fields are error, message, and timestamp.
{
  "$schema": "http://json-schema.org/draft/2020-12/schema",
  "title": "ErrorResponse",
  "type": "object",
  "required": ["error", "message", "timestamp"],
  "properties": {
    "error": {
      "type": "string",
      "description": "Error category/code"
    },
    "message": {
      "type": "string",
      "description": "Human-readable error message"
    },
    "timestamp": {
      "type": "string",
      "format": "date-time"
    },
    "context": {
      "type": "object",
      "description": "Additional error context"
    },
    "trace_id": {
      "type": "string",
      "description": "Distributed trace identifier"
    },
    "request_id": {
      "type": "string",
      "description": "Correlation ID for request"
    },
    "code": {
      "type": "string",
      "description": "Machine-readable error code (e.g., AUTH-1001)"
    },
    "documentation_url": {
      "type": "string",
      "description": "URL to error documentation"
    }
  }
}
Exception Hierarchy
(See Exception Hierarchy section below for detailed class definitions.)
Functional Requirements
FR-001: Structured Logging Framework
REQ-100-003: The system MUST provide a structured logging framework that outputs JSON-formatted log entries with consistent field names and types.
Acceptance Criteria:
- REQ-100-004: All log entries SHALL include timestamp, level, logger, event, and component fields
- REQ-100-005: Log entries SHALL be able to include optional context fields (request_id, user_id, trace_id, etc.)
- REQ-100-006: Log format SHALL be configurable as JSON (production) or console (development)
- REQ-100-007: Log levels SHALL be configurable via environment variable
FR-002: Exception Hierarchy
REQ-100-008: The system MUST implement a hierarchical exception classification system with base and domain-specific exception classes.
Acceptance Criteria:
- REQ-100-009: A base exception class
UltimateBaseErrorcarrying a context dictionary SHALL be provided - REQ-100-010: Domain exception categories (ConfigurationError, ValidationError, etc.) SHALL be provided
- REQ-100-011: Specialized exceptions (NotFoundError, TimeoutError, etc.) SHALL be provided
- REQ-100-012: All exceptions SHALL be convertible to structured dictionary format
FR-003: Distributed Tracing
REQ-100-013: The system MUST support distributed tracing across component boundaries with trace context propagation.
Acceptance Criteria:
- REQ-100-014: Trace context SHALL be propagated via headers in HTTP requests and async context
- REQ-100-015: Spans SHALL be created for major operations with configurable sampling
- REQ-100-016: Span attributes SHALL include component, operation, and resource identifiers
- REQ-100-017: Traces SHALL be correlated with logs via the trace_id field
FR-004: Metrics Collection
REQ-100-018: The system MUST collect and expose operational metrics in Prometheus format.
Acceptance Criteria:
- REQ-100-019: Counter metrics SHALL be provided for request counts and error rates
- REQ-100-020: Histogram metrics SHALL be provided for request durations with configurable buckets
- REQ-100-021: Gauge metrics SHALL be provided for resource usage and active requests
- REQ-100-022: Metrics SHALL be exposed at the
/metricsendpoint with proper labeling
FR-005: Error Handling Patterns
REQ-100-023: The system MUST implement standard error handling patterns including retry with exponential backoff and circuit breaker.
Acceptance Criteria:
- REQ-100-024: The retry mechanism SHALL support configurable attempts, delays, and backoff factor
- REQ-100-025: The circuit breaker SHALL support configurable failure thresholds and reset timeouts
- REQ-100-026: A graceful degradation decorator SHALL provide fallback behavior
- REQ-100-027: All of these patterns SHALL support both sync and async operations
FR-006: Log Context Propagation
REQ-100-028: The system MUST automatically propagate log context (request_id, user_id, etc.) across async/thread boundaries.
Acceptance Criteria:
- REQ-100-029: Context SHALL be propagated via thread-local storage for sync operations
- REQ-100-030: Context SHALL be propagated via contextvars for async operations
- REQ-100-031: Context SHALL be automatically included in all log entries within request scope
- REQ-100-032: Context SHALL be manually extensible with additional fields
FR-007: Configuration Management
REQ-100-033: The system MUST configure logging, tracing, and metrics via environment variables.
Acceptance Criteria:
- REQ-100-034: Log level SHALL be configurable via the
LOG_LEVELenvironment variable - REQ-100-035: Log format SHALL be configurable via the
LOG_FORMATenvironment variable - REQ-100-036: Tracing SHALL be enabled/disabled via the
TRACING_ENABLEDenvironment variable - REQ-100-037: Metrics port SHALL be configurable via the
METRICS_PORTenvironment variable
FR-008: Performance Requirements
REQ-100-101: The system MUST meet performance benchmarks for logging, tracing, and metrics operations.
Acceptance Criteria:
- REQ-100-102: Logging throughput SHALL be ≥10,000 logs/sec per component
- REQ-100-103: Span creation latency SHALL be ≤100μs per span
- REQ-100-104: Metric collection latency SHALL be ≤10ms per metric update
- REQ-100-105: Error handling overhead SHALL be ≤5ms per error
FR-009: Security and Compliance
REQ-100-106: The system MUST implement security and compliance requirements for observability data.
Acceptance Criteria:
- REQ-100-107: No PII SHALL be logged without explicit consent
- REQ-100-108: Log data SHALL be encrypted in transit and at rest
- REQ-100-109: Access controls SHALL be enforced for log data and metrics
- REQ-100-110: Access to audit logs SHALL itself be audit-logged
FR-010: Integration Requirements
REQ-100-038: The system MUST integrate with external observability services.
Acceptance Criteria:
- REQ-100-039: Logs SHALL be deliverable to a centralized aggregation service (Loki, ELK, etc.)
- REQ-100-040: Traces SHALL be exportable to a tracing backend (Jaeger, Tempo, etc.)
- REQ-100-041: Metrics SHALL be scrapable by Prometheus-compatible systems
- REQ-100-042: Health checks SHALL be exposable at the
/healthendpoint
User Scenarios
US-001: Developer Debugging Production Issues
As a developer I want to search and analyze structured logs with rich context So that I can quickly diagnose and fix production issues
Acceptance Criteria:
REQ-100-043: Structured logs SHALL satisfy the developer-debugging criteria below — component, request_id and user context on every log; filtering by severity, component and time range; stack traces and relevant state on error logs; correlation IDs connecting related entries across services; and log retention of 30 days minimum.
- All logs include component, request_id, and user context
- Logs can be filtered by severity, component, and time range
- Error logs include stack traces and relevant state
- Correlation IDs connect related log entries across services
- Log retention of 30 days minimum
US-002: System Administrator Monitoring Health
As a system administrator I want to monitor system health through metrics and alerts So that I can proactively address issues before they impact users
Acceptance Criteria:
REQ-100-044: Health monitoring SHALL satisfy the system-administrator criteria below — key metrics exposed via the Prometheus endpoint; alerts configured for critical failures and performance degradation; dashboards showing system health and performance trends; capacity-planning metrics (memory, CPU, disk, network); and SLA/SLO tracking with error budgets.
- Key metrics exposed via Prometheus endpoint
- Alerts configured for critical failures and performance degradation
- Dashboards showing system health and performance trends
- Capacity planning metrics (memory, CPU, disk, network)
- SLA/SLO tracking with error budgets
US-003: Security Auditor Investigating Incidents
As a security auditor I want to trace user actions through audit logs So that I can investigate security incidents and ensure compliance
Acceptance Criteria:
REQ-100-045: Audit logging SHALL satisfy the security-auditor criteria below — all security-sensitive operations logged with user context; audit logs immutable and tamper-evident; before/after state recorded for mutations; access-control checks logged at DEBUG level; and audit-log retention of 90 days minimum.
- All security-sensitive operations logged with user context
- Audit logs are immutable and tamper-evident
- Logs include before/after state for mutations
- Access control checks logged at DEBUG level
- Retention of audit logs for 90 days minimum
US-004: Performance Engineer Analyzing Bottlenecks
As a performance engineer I want to analyze distributed traces and performance metrics So that I can identify and optimize performance bottlenecks
Acceptance Criteria:
REQ-100-046: Performance analysis SHALL satisfy the performance-engineer criteria below — distributed tracing with OpenTelemetry across all components; trace sampling configurable based on load; span durations and metadata for all major operations; performance metrics (latency, throughput, error rates); and correlation between traces, logs and metrics.
- Distributed tracing with OpenTelemetry across all components
- Trace sampling configurable based on load
- Span durations and metadata for all major operations
- Performance metrics (latency, throughput, error rates)
- Correlation between traces, logs, and metrics
US-005: Developer Writing Error-Resilient Code
As a developer I want to use consistent exception patterns and error handling So that my code is robust and failures are properly communicated
Acceptance Criteria:
REQ-100-047: The error-handling surface SHALL satisfy the developer criteria below — a clear exception hierarchy with proper inheritance; context carried on every exception; error-recovery patterns (retry, fallback, circuit breaker); graceful degradation when dependencies fail; and comprehensive error documentation.
- Clear exception hierarchy with proper inheritance
- All exceptions include context for debugging
- Error recovery patterns (retry, fallback, circuit breaker)
- Graceful degradation when dependencies fail
- Comprehensive error documentation
Exception Hierarchy
Base Exception Classes
class UltimateBaseError(Exception):
    """Base exception for all orchestrata-ultimate errors."""

    def __init__(self, message: str, context: Optional[Dict[str, Any]] = None):
        self.message = message
        self.context = context or {}
        self.timestamp = datetime.now()
        super().__init__(message)

    def to_dict(self) -> Dict[str, Any]:
        """Convert exception to structured dictionary."""
        return {
            "type": self.__class__.__name__,
            "message": self.message,
            "context": self.context,
            "timestamp": self.timestamp.isoformat(),
        }
Domain-Specific Exception Categories
class ConfigurationError(UltimateBaseError):
    """Configuration-related errors."""

class ValidationError(UltimateBaseError):
    """Input validation errors."""

class AuthenticationError(UltimateBaseError):
    """Authentication failures."""

class AuthorizationError(UltimateBaseError):
    """Authorization/access control failures."""

class ResourceError(UltimateBaseError):
    """Resource-related errors (not found, conflict, etc.)."""

class IntegrationError(UltimateBaseError):
    """External integration failures."""

class GovernanceError(UltimateBaseError):
    """Governance policy violations."""

class SystemError(UltimateBaseError):
    """System/internal errors (bugs, invariants violated)."""
Specialized Exceptions
class NotFoundError(ResourceError):
    """Requested resource not found."""

class ConflictError(ResourceError):
    """Resource conflict (e.g., duplicate, already exists)."""

class RateLimitError(AuthorizationError):
    """Rate limit exceeded."""

class TimeoutError(IntegrationError):
    """Operation timeout."""

class CircuitBreakerOpenError(IntegrationError):
    """Circuit breaker is open, preventing requests."""
Structured Logging
Log Levels and Usage
| Level | When to Use | Example |
|---|---|---|
| TRACE | Extremely detailed debugging | Function entry/exit with parameters |
| DEBUG | Detailed debugging information | State transitions, decision logic |
| INFO | Normal operational messages | Service startup, configuration loaded |
| WARNING | Unexpected but handled situations | Deprecated API usage, performance warnings |
| ERROR | Error conditions that affect single operation | Failed request, validation error |
| CRITICAL | System-level failures | Out of memory, disk full, unrecoverable state |
Log Context Requirements
REQ-100-048: All log entries MUST include the fields listed below — timestamp, level, logger, event, component, request_id, and session_id (where applicable):
timestamp: ISO 8601 formatlevel: Log levellogger: Logger name (usually module path)event: Descriptive event messagecomponent: Component identifier (e.g., "orchestrator", "cxp", "knowledge_graph")request_id: Correlation ID for the current request/operationsession_id: User session identifier (if applicable)
Optional context based on operation type:
user_id: Authenticated user identifieragent_id: Agent identifier for agent operationsfile_path: File path for file operationsintent_id: Intent identifier for intent processingtrace_id: Distributed trace identifierspan_id: Current span identifierduration_ms: Operation duration in millisecondsstatus: Operation status (success, failure, partial)
Log Configuration
# Example configuration
import structlog
from structlog.processors import JSONRenderer, TimeStamper
from structlog.stdlib import add_log_level, filter_by_level

def configure_logging(level: str = "INFO", json_output: bool = True):
    """Configure structured logging for the application."""

    processors = [
        filter_by_level,
        add_log_level,
        structlog.processors.StackInfoRenderer(),
        structlog.processors.format_exc_info,
        TimeStamper(fmt="iso"),
        structlog.processors.UnicodeDecoder(),
    ]

    if json_output:
        processors.append(JSONRenderer())
    else:
        processors.append(structlog.dev.ConsoleRenderer())

    structlog.configure(
        processors=processors,
        wrapper_class=structlog.stdlib.BoundLogger,
        context_class=dict,
        logger_factory=structlog.stdlib.LoggerFactory(),
        cache_logger_on_first_use=True,
    )

    # Configure standard library logging
    import logging
    logging.basicConfig(level=getattr(logging, level.upper()))
Distributed Tracing
Trace Context Propagation
from opentelemetry import trace
from opentelemetry.trace.propagation.tracecontext import TraceContextTextMapPropagator

class TracingContext:
    """Manage distributed tracing context."""

    def __init__(self):
        self.tracer = trace.get_tracer(__name__)
        self.propagator = TraceContextTextMapPropagator()

    def start_span(self, name: str, context: Optional[Dict] = None) -> trace.Span:
        """Start a new span with optional parent context."""
        return self.tracer.start_span(name, context=context)

    def inject_context(self, carrier: Dict):
        """Inject trace context into carrier for propagation."""
        self.propagator.inject(carrier)

    def extract_context(self, carrier: Dict) -> trace.SpanContext:
        """Extract trace context from carrier."""
        return self.propagator.extract(carrier)
Span Attributes
All spans SHOULD include:
component: Component identifieroperation: Operation nameuser_id: User identifier (if authenticated)agent_id: Agent identifier (if applicable)intent_id: Intent identifier (if applicable)resource.type: Type of resource being accessedresource.id: Resource identifier (if applicable)
REQ-100-049: Error spans MUST include error.type, error.message, and error.stacktrace:
error.type: Exception typeerror.message: Exception messageerror.stacktrace: Exception stack trace (for DEBUG/TRACE levels)
Metrics Collection
Required Metrics
REQ-100-050: The system MUST expose the metrics enumerated below — requests_total, request_duration_seconds, active_requests, errors_total, memory_usage_bytes, and business_events_total — each with the stated metric type and labels.
| Metric Type | Name | Description | Labels |
|---|---|---|---|
| Counter | requests_total |
Total number of requests | method, endpoint, status |
| Histogram | request_duration_seconds |
Request duration in seconds | method, endpoint |
| Gauge | active_requests |
Currently active requests | component |
| Counter | errors_total |
Total number of errors | component, error_type |
| Gauge | memory_usage_bytes |
Memory usage in bytes | component |
| Counter | business_events_total |
Business events counter | event_type, component |
Metrics Configuration
from prometheus_client import Counter, Histogram, Gauge

# Define metrics
REQUESTS_TOTAL = Counter(
    'orchestrata_requests_total',
    'Total number of requests',
    ['method', 'endpoint', 'status']
)

REQUEST_DURATION = Histogram(
    'orchestrata_request_duration_seconds',
    'Request duration in seconds',
    ['method', 'endpoint'],
    buckets=(0.01, 0.05, 0.1, 0.5, 1.0, 5.0)
)

ACTIVE_REQUESTS = Gauge(
    'orchestrata_active_requests',
    'Currently active requests',
    ['component']
)
Error Handling Patterns
Retry with Exponential Backoff
import asyncio
from typing import Callable, TypeVar, Optional
from datetime import datetime, timedelta

T = TypeVar('T')

async def retry_with_backoff(
    operation: Callable[[], T],
    max_retries: int = 3,
    initial_delay: float = 0.1,
    max_delay: float = 10.0,
    backoff_factor: float = 2.0,
    retryable_errors: Optional[tuple] = None,
) -> T:
    """Execute operation with retry and exponential backoff."""

    retryable_errors = retryable_errors or (TimeoutError, IntegrationError)
    last_error = None

    for attempt in range(max_retries + 1):
        try:
            return await operation() if asyncio.iscoroutinefunction(operation) else operation()
        except retryable_errors as e:
            last_error = e

            if attempt == max_retries:
                logger.warning(
                    "Operation failed after max retries",
                    attempt=attempt,
                    error=str(e),
                    max_retries=max_retries,
                )
                raise

            delay = min(initial_delay * (backoff_factor ** attempt), max_delay)
            logger.debug(
                "Operation failed, retrying",
                attempt=attempt,
                error=str(e),
                next_retry_ms=delay * 1000,
            )

            await asyncio.sleep(delay)

    raise last_error
Circuit Breaker Pattern
from enum import Enum
from datetime import datetime, timedelta

class CircuitState(Enum):
    CLOSED = "closed"
    OPEN = "open"
    HALF_OPEN = "half_open"

class CircuitBreaker:
    """Circuit breaker pattern for integration calls."""

    def __init__(
        self,
        failure_threshold: int = 5,
        reset_timeout: timedelta = timedelta(seconds=30),
    ):
        self.state = CircuitState.CLOSED
        self.failure_count = 0
        self.failure_threshold = failure_threshold
        self.reset_timeout = reset_timeout
        self.last_failure_time = None

    async def execute(self, operation: Callable) -> Any:
        """Execute operation with circuit breaker protection."""

        if self.state == CircuitState.OPEN:
            if datetime.now() - self.last_failure_time > self.reset_timeout:
                self.state = CircuitState.HALF_OPEN
                logger.info("Circuit breaker transitioning to half-open")
            else:
                raise CircuitBreakerOpenError(
                    f"Circuit breaker is open. Next reset in {self.reset_timeout.total_seconds()}s"
                )

        try:
            result = await operation() if asyncio.iscoroutinefunction(operation) else operation()

            if self.state == CircuitState.HALF_OPEN:
                self.state = CircuitState.CLOSED
                self.failure_count = 0
                logger.info("Circuit breaker reset to closed")

            return result

        except Exception as e:
            self.failure_count += 1
            self.last_failure_time = datetime.now()

            if self.failure_count >= self.failure_threshold:
                self.state = CircuitState.OPEN
                logger.error(
                    "Circuit breaker opened",
                    failure_count=self.failure_count,
                    threshold=self.failure_threshold,
                    error=str(e),
                )

            raise
Graceful Degradation
from typing import Optional, Callable, Any
from functools import wraps

def graceful_degradation(fallback_value: Any = None, fallback_func: Optional[Callable] = None):
    """Decorator for graceful degradation when primary operation fails."""

    def decorator(func: Callable):
        @wraps(func)
        async def async_wrapper(*args, **kwargs):
            try:
                return await func(*args, **kwargs)
            except Exception as e:
                logger.warning(
                    "Primary operation failed, using graceful degradation",
                    func=func.__name__,
                    error=str(e),
                )

                if fallback_func:
                    return await fallback_func(*args, **kwargs) if asyncio.iscoroutinefunction(fallback_func) else fallback_func(*args, **kwargs)
                return fallback_value

        @wraps(func)
        def sync_wrapper(*args, **kwargs):
            try:
                return func(*args, **kwargs)
            except Exception as e:
                logger.warning(
                    "Primary operation failed, using graceful degradation",
                    func=func.__name__,
                    error=str(e),
                )

                if fallback_func:
                    return fallback_func(*args, **kwargs)
                return fallback_value

        return async_wrapper if asyncio.iscoroutinefunction(func) else sync_wrapper

    return decorator
Implementation Requirements
Logging Library Requirements
- REQ-100-051: MUST use
structlogfor all application logging - REQ-100-052: MUST output JSON format in production environments
- REQ-100-053: MUST include correlation IDs in all log entries
- REQ-100-054: MUST configure log levels via environment variable
LOG_LEVEL - SHOULD use async log handlers for high-throughput scenarios
- SHOULD include source location (file, line) for DEBUG/TRACE levels
Exception Requirements
- REQ-100-055: MUST use exception hierarchy defined in this specification
- REQ-100-056: MUST include context dictionary in all custom exceptions
- REQ-100-057: MUST log exceptions at appropriate level (ERROR for unexpected, WARNING for expected)
- REQ-100-058: MUST preserve original exception chain using
raise ... from ... - SHOULD convert library exceptions to domain exceptions at boundary layers
Metrics Requirements
- MUST expose Prometheus metrics at
/metricsendpoint (stated as REQ-100-022) - REQ-100-059: MUST include component label in all metrics
- REQ-100-060: MUST track request duration for all external-facing operations
- SHOULD track business metrics relevant to domain operations
- SHOULD use histogram with appropriate buckets for latency metrics
Tracing Requirements
- REQ-100-061: MUST propagate trace context across all async/thread boundaries
- MUST include trace ID in all log entries when available (stated as REQ-100-017)
- SHOULD sample traces based on configurable sampling rate
- SHOULD include domain-specific attributes in spans
- MAY disable tracing in development environments for performance
Configuration
REQ-100-062: The system MUST read its observability configuration from the environment variables below, honouring the stated value domains and defaults (METRICS_PORT default 9090; TRACING_SAMPLE_RATE in 0.0-1.0, default 0.1):
LOG_LEVEL: Log level (TRACE, DEBUG, INFO, WARNING, ERROR, CRITICAL)LOG_FORMAT: Log format (json, console)METRICS_PORT: Prometheus metrics port (default: 9090)TRACING_ENABLED: Enable distributed tracing (true/false)TRACING_SAMPLE_RATE: Trace sampling rate (0.0-1.0, default: 0.1)
Error Conditions
Error Categories
REQ-100-063: Every error MUST be classified into one of the categories below and carry an error code drawn from that category's code range: AUTH (1000-1099), AUTHZ (1100-1199), VAL (1200-1299), RES (1300-1399), INT (1400-1499), SYS (1500-1599), GOV (1600-1699).
| Category | Code Range | Description | Examples |
|---|---|---|---|
| AUTH | 1000-1099 | Authentication errors | Invalid credentials, token expired |
| AUTHZ | 1100-1199 | Authorization errors | Insufficient permissions, rate limit |
| VAL | 1200-1299 | Validation errors | Invalid input, missing required field |
| RES | 1300-1399 | Resource errors | Not found, conflict, unavailable |
| INT | 1400-1499 | Integration errors | External service failure, timeout |
| SYS | 1500-1599 | System errors | Internal error, bug, invariant violation |
| GOV | 1600-1699 | Governance errors | Policy violation, escalation required |
Specific Error Conditions
REQ-100-064: A minimum of 10 error conditions MUST be defined and handled; each condition below MUST be raised on its stated trigger, logged at its stated severity, and carry its stated log context.
-
REQ-100-065: The system MUST handle ERR-001: Authentication Failed (
AUTH-1001)
Trigger: Invalid credentials or expired token
Severity: ERROR
Recovery: Re-authenticate with valid credentials
Log Context:user_id,auth_method,reason -
REQ-100-066: The system MUST handle ERR-002: Rate Limit Exceeded (
AUTHZ-1101)
Trigger: Request rate exceeds configured limit
Severity: WARNING
Recovery: Wait for rate limit window to reset
Log Context:user_id,endpoint,limit,window_sec -
REQ-100-067: The system MUST handle ERR-003: Invalid Input Validation (
VAL-1201)
Trigger: Request validation fails (missing fields, type mismatches)
Severity: WARNING
Recovery: Correct request payload
Log Context:field,expected,actual,validation_rule -
REQ-100-068: The system MUST handle ERR-004: Resource Not Found (
RES-1301)
Trigger: Requested resource does not exist
Severity: WARNING
Recovery: Check resource identifier and retry
Log Context:resource_type,resource_id,operation -
REQ-100-069: The system MUST handle ERR-005: Resource Conflict (
RES-1302)
Trigger: Resource already exists or version conflict
Severity: WARNING
Recovery: Use update instead of create, or resolve conflict
Log Context:resource_type,resource_id,conflict_type -
REQ-100-070: The system MUST handle ERR-006: External Service Timeout (
INT-1401)
Trigger: External service does not respond within timeout
Severity: ERROR
Recovery: Retry with exponential backoff, implement circuit breaker
Log Context:service,endpoint,timeout_ms,attempt -
REQ-100-071: The system MUST handle ERR-007: External Service Error (
INT-1402)
Trigger: External service returns error response
Severity: ERROR
Recovery: Validate request, check service status, retry if transient
Log Context:service,endpoint,status_code,error_message -
REQ-100-072: The system MUST handle ERR-008: Internal System Error (
SYS-1501)
Trigger: Bug, invariant violation, or unexpected state
Severity: CRITICAL
Recovery: Requires developer intervention, system may be unstable
Log Context:component,file,line,stack_trace,state -
REQ-100-073: The system MUST handle ERR-009: Configuration Error (
SYS-1502)
Trigger: Invalid or missing configuration
Severity: ERROR
Recovery: Update configuration file or environment variables
Log Context:config_key,expected,actual,source -
REQ-100-074: The system MUST handle ERR-010: Logging Infrastructure Unavailable (
INT-1403)
Trigger: Log aggregation service unreachable
Severity: WARNING
Recovery: Buffer logs locally, retry periodically, degrade gracefully
Log Context:log_service,endpoint,error,buffer_size -
REQ-100-075: The system MUST handle ERR-011: Trace Context Propagation Failed (
SYS-1503)
Trigger: Distributed trace context cannot be propagated
Severity: WARNING
Recovery: Generate new trace context, continue without parent trace
Log Context:operation,carrier_type,error,new_trace_id -
REQ-100-076: The system MUST handle ERR-012: Metrics Collection Overload (
SYS-1504)
Trigger: Metrics collection causing performance degradation
Severity: WARNING
Recovery: Reduce metrics cardinality, increase collection interval
Log Context:metric,cardinality,collection_interval,impact
Error Handling Requirements
- REQ-100-077: MUST log all errors with appropriate severity level
- REQ-100-078: MUST include error context for debugging
- REQ-100-079: MUST map exceptions to error categories
- REQ-100-080: MUST provide human-readable error messages
- SHOULD include recovery suggestions in error responses
- SHOULD track error rates per category for monitoring
Observability
Logging Observability
Logging forms the foundation of observability, providing structured, contextual data about system behavior. See Structured Logging section for log format requirements and Log Context Requirements for mandatory fields.
Metrics Observability
Metrics provide quantitative measurements of system performance and health. See Metrics Collection section for required metrics and Metrics Configuration for implementation details.
Tracing Observability
Distributed tracing enables end-to-end request flow analysis across component boundaries. See Distributed Tracing section for trace context propagation and span attributes.
Alerting and Monitoring
REQ-100-081: Observability data MUST be used for proactive alerting and monitoring, covering the alerts and thresholds below:
- Critical Error Alerts: Alert on error rate spikes (>5% error rate)
- Performance Alerts: Alert on latency degradation (>P95 threshold)
- Resource Alerts: Alert on memory/CPU/Disk usage (>80% utilization)
- Business Metric Alerts: Alert on key business metric anomalies
Observability Integration
REQ-100-082: All three pillars of observability (logs, metrics, traces) MUST be correlated by the mechanisms below:
- Trace ID in logs: Include
trace_idin all log entries when available - Log references in traces: Include log correlation identifiers in span attributes
- Metrics labels: Include component, operation, and status labels in metrics
- Unified dashboard: Single pane of glass for logs, metrics, and traces
Observability Quality Gates
- REQ-100-111: Log completeness: ≥99% of operations produce at least one log entry
- REQ-100-112: Metric freshness: Metrics updated at least every 15 seconds
- REQ-100-113: Trace sampling: ≥10% of requests sampled for traces in production
- REQ-100-114: Alert coverage: All critical failure modes have corresponding alerts
- REQ-100-115: Dashboard latency: Observability data available within 30 seconds of generation
API Contracts
Logging Configuration API
REQ-100-083: The system MUST expose GET /api/v1/logging/config returning the current logging configuration in the shape below, whose required fields are level, format, and component.
# GET /api/v1/logging/config
# Response: Current logging configuration
response:
  type: object
  required:
    - level
    - format
    - component
  properties:
    level:
      type: string
      enum: [TRACE, DEBUG, INFO, WARNING, ERROR, CRITICAL]
    format:
      type: string
      enum: [json, console]
    component:
      type: string
    filters:
      type: array
      items:
        type: string
    sampling_rate:
      type: number
      minimum: 0.0
      maximum: 1.0
Error Response API
REQ-100-084: All HTTP 4xx/5xx error responses MUST follow the contract below, whose required fields are error, message, and timestamp:
# HTTP 4xx/5xx Error Response
response:
  type: object
  required:
    - error
    - message
    - timestamp
  properties:
    error:
      type: string
      description: Error category/code
    message:
      type: string
      description: Human-readable error message
    timestamp:
      type: string
      format: date-time
    request_id:
      type: string
      description: Correlation ID for request
    trace_id:
      type: string
      description: Distributed trace identifier
    documentation_url:
      type: string
      format: uri
      description: URL to error documentation
    details:
      type: array
      items:
        type: object
        properties:
          field:
            type: string
          message:
            type: string
          code:
            type: string
Metrics Export API
REQ-100-085: The system MUST expose GET /metrics returning metrics in Prometheus exposition text format.
# GET /metrics
# Response: Prometheus metrics in text format
response:
  type: string
  format: prometheus-text
  description: Prometheus exposition format
Health Check API
REQ-100-086: The system MUST expose GET /health returning component health status in the shape below, whose required fields are status (one of healthy, degraded, unhealthy) and timestamp.
# GET /health
# Response: Component health status
response:
  type: object
  required:
    - status
    - timestamp
  properties:
    status:
      type: string
      enum: [healthy, degraded, unhealthy]
    timestamp:
      type: string
      format: date-time
    components:
      type: object
      additionalProperties:
        type: string
        enum: [healthy, degraded, unhealthy]
    version:
      type: string
    uptime_seconds:
      type: number
Contract Compliance Requirements
- REQ-100-087: MUST validate error responses against schema in test suites
- REQ-100-088: MUST document all logging configuration parameters
- MUST expose metrics endpoint at
/metrics(stated as REQ-100-022) - MUST expose health endpoint at
/health(stated as REQ-100-042) - SHOULD version APIs using path prefix (
/api/v1/) - SHOULD provide OpenAPI/Swagger documentation for all APIs
Testing Requirements
Unit Testing Requirements
REQ-100-089: The test suite MUST cover the unit-testing areas below: logging configuration, exception hierarchy, metrics collection, and tracing context.
-
Logging Configuration Tests
- Test all log levels produce appropriate output
- Test JSON vs console format switching
- Test log filtering by component and level
- Test structured log field inclusion
-
Exception Hierarchy Tests
- Test exception inheritance relationships
- Test context preservation in exceptions
- Test error code mapping
- Test exception serialization to dict
-
Metrics Collection Tests
- Test counter increment/decrement
- Test histogram bucket distribution
- Test gauge value updates
- Test label consistency across metrics
-
Tracing Context Tests
- Test trace context propagation
- Test span creation and attributes
- Test parent-child span relationships
- Test trace sampling behavior
Integration Testing Requirements
-
Log Aggregation Integration
- Test log delivery to aggregation service
- Test log buffering during service outages
- Test log format compatibility with aggregator
- Test log volume and performance under load
-
Metrics Integration
- Test metrics scraping by Prometheus
- Test metric label cardinality limits
- Test long-running metric consistency
- Test alert rule evaluation based on metrics
-
Tracing Integration
- Test trace export to tracing backend
- Test trace sampling configuration
- Test span attribute inclusion in traces
- Test trace correlation with logs
Performance Testing Requirements
-
Logging Performance
- Measure log throughput (logs/sec)
- Measure log latency impact on application
- Measure memory usage of log buffering
- Measure disk I/O for local log storage
-
Metrics Performance
- Measure metrics collection overhead
- Measure memory usage per metric series
- Measure scrape duration under high cardinality
- Measure alert evaluation performance
-
Tracing Performance
- Measure span creation overhead
- Measure trace export throughput
- Measure memory usage of span buffers
- Measure sampling impact on performance
Test Data Requirements
-
Log Test Data
- Generate synthetic log entries with varied contexts
- Include edge cases (unicode, large payloads, special characters)
- Include error conditions and stack traces
- Include high-cardinality label combinations
-
Metric Test Data
- Generate time-series data with realistic patterns
- Include spike, dip, and seasonal patterns
- Include outlier values for histogram testing
- Include label combinations at cardinality limits
Test Automation Requirements
-
CI/CD Integration
- Run logging tests on every commit
- Run performance tests nightly
- Run integration tests against staging environments
- Generate test coverage reports for observability code
-
Test Reporting
- Report test results to monitoring system
- Track test flakiness and reliability
- Alert on test performance regressions
- Generate compliance reports for audit purposes
Performance Benchmarks
Logging Performance Targets
| Metric | Target | Measurement Method |
|---|---|---|
| Log throughput | ≥10,000 logs/sec per component | Load testing with synthetic log generation |
| Log latency | ≤1ms P99 for local logging | Microbenchmark with high-resolution timers |
| Memory overhead | ≤1MB per 10,000 log entries | Memory profiling during sustained logging |
| CPU overhead | ≤5% CPU utilization at max throughput | CPU profiling under load |
| Disk I/O | ≤10 MB/sec write throughput | I/O monitoring during log buffering |
Metrics Performance Targets
| Metric | Target | Measurement Method |
|---|---|---|
| Metric collection latency | ≤10ms per metric update | Microbenchmark of metric instrumentation |
| Metric export latency | ≤100ms for full scrape | Prometheus scrape duration measurement |
| Memory per metric series | ≤1KB per unique time series | Memory profiling with varying cardinality |
| Label cardinality limit | ≤10,000 unique label combinations | Stress testing with high-cardinality labels |
Tracing Performance Targets
| Metric | Target | Measurement Method |
|---|---|---|
| Span creation latency | ≤100μs per span | Microbenchmark of span creation |
| Trace export throughput | ≥1,000 spans/sec | Load testing with trace generation |
| Trace sampling overhead | ≤1% CPU at 100% sampling | CPU profiling with sampling disabled/enabled |
| Context propagation latency | ≤10μs per propagation | Microbenchmark of trace context operations |
Error Handling Performance Targets
| Metric | Target | Measurement Method |
|---|---|---|
| Exception creation | ≤50μs per exception | Microbenchmark of exception instantiation |
| Error logging latency | ≤5ms P99 for error logging | Load testing with error injection |
| Circuit breaker overhead | ≤1ms per protected call | Microbenchmark of circuit breaker execution |
| Retry mechanism overhead | ≤2ms per retry attempt | Microbenchmark of retry with backoff |
Scalability Benchmarks
- Horizontal Scaling: System must maintain performance targets when scaled to 100 instances
- Load Increase: Performance degradation must be linear (not exponential) with load increase
- Memory Leak: Zero memory leak over 72-hour continuous operation
- GC Impact: Garbage collection pauses ≤100ms P99 for observability operations
Benchmark Validation Requirements
- MUST run performance benchmarks as part of CI/CD pipeline
- MUST track benchmark results over time for regression detection
- MUST alert on performance regression >10%
- SHOULD automate benchmark execution with reproducible environment
- SHOULD include real-world workload patterns in benchmarks
Examples
Example 1: Complete Log Entry
{
  "timestamp": "2026-04-10T14:30:45.123456Z",
  "level": "ERROR",
  "logger": "orchestrata.ultimate.orchestrator",
  "event": "Failed to process intent",
  "component": "orchestrator",
  "request_id": "req_abc123def456",
  "session_id": "sess_xyz789",
  "user_id": "user_987654",
  "trace_id": "trace_00f067aa0ba902b7",
  "span_id": "span_00f067aa0ba902b7",
  "duration_ms": 125.5,
  "status": "failure",
  "error": {
    "type": "IntegrationError",
    "message": "External service timeout",
    "stacktrace": "Traceback (most recent call last):\n  File \"orchestrator.py\", line 456, in process_intent\n    result = await external_service.call()\n  File \"external.py\", line 123, in call\n    raise TimeoutError(\"Service timeout after 5s\")\nIntegrationError: External service timeout"
  },
  "intent_id": "intent_12345",
  "agent_id": "agent_67890",
  "attempt": 3,
  "max_retries": 5
}
Example 2: Error Response
{
  "error": "INT-1401",
  "message": "External service timeout after 5 seconds",
  "timestamp": "2026-04-10T14:30:45.123456Z",
  "context": {
    "service": "payment_gateway",
    "endpoint": "/api/v1/process",
    "timeout_ms": 5000,
    "attempt": 3,
    "max_retries": 5
  },
  "trace_id": "trace_00f067aa0ba902b7",
  "request_id": "req_abc123def456",
  "code": "INT-1401",
  "documentation_url": "https://docs.orchestrata-ultimate.com/errors/INT-1401",
  "details": [
    {
      "field": "payment_gateway_endpoint",
      "message": "Service did not respond within timeout",
      "code": "TIMEOUT"
    }
  ]
}
Example 3: Structured Log Configuration
# config/logging_config.py
import structlog
from structlog.processors import JSONRenderer, TimeStamper
from structlog.stdlib import add_log_level, filter_by_level

def configure_logging(level: str = "INFO", json_output: bool = True):
    """Configure structured logging for the application."""

    processors = [
        filter_by_level,
        add_log_level,
        structlog.processors.StackInfoRenderer(),
        structlog.processors.format_exc_info,
        TimeStamper(fmt="iso"),
        structlog.processors.UnicodeDecoder(),
        structlog.processors.EventRenamer("event"),
    ]

    if json_output:
        processors.append(JSONRenderer())
    else:
        processors.append(structlog.dev.ConsoleRenderer())

    structlog.configure(
        processors=processors,
        wrapper_class=structlog.stdlib.BoundLogger,
        context_class=dict,
        logger_factory=structlog.stdlib.LoggerFactory(),
        cache_logger_on_first_use=True,
    )

    # Configure standard library logging
    import logging
    logging.basicConfig(level=getattr(logging, level.upper()))

# Usage
log = structlog.get_logger()
log.info("User authenticated", user_id="user_123", method="oauth2", success=True)
Example 4: Exception Usage
from exceptions import IntegrationError, TimeoutError, retry_with_backoff

async def process_payment(amount: float, currency: str) -> dict:
    """Process payment with retry and circuit breaker."""

    async def call_payment_gateway():
        # Simulate external service call
        response = await http_client.post(
            "https://api.payment.example/charge",
            json={"amount": amount, "currency": currency},
            timeout=5.0
        )
        if response.status_code >= 500:
            raise IntegrationError(
                "Payment gateway service error",
                context={
                    "status_code": response.status_code,
                    "service": "payment_gateway"
                }
            )
        return response.json()

    try:
        # Use retry with exponential backoff
        return await retry_with_backoff(
            call_payment_gateway,
            max_retries=3,
            initial_delay=0.1,
            retryable_errors=(TimeoutError, IntegrationError)
        )
    except IntegrationError as e:
        log.error("Payment processing failed", error=e.to_dict())
        raise
Example 5: Metrics Collection
from prometheus_client import Counter, Histogram, generate_latest

# Define metrics
REQUESTS_TOTAL = Counter(
    'orchestrata_requests_total',
    'Total number of requests',
    ['method', 'endpoint', 'status']
)

REQUEST_DURATION = Histogram(
    'orchestrata_request_duration_seconds',
    'Request duration in seconds',
    ['method', 'endpoint'],
    buckets=(0.01, 0.05, 0.1, 0.5, 1.0, 5.0)
)

# Instrument a function
import time
from functools import wraps

def instrument_request(method: str, endpoint: str):
    """Decorator to instrument request metrics."""
    def decorator(func):
        @wraps(func)
        async def wrapper(*args, **kwargs):
            start_time = time.time()
            try:
                result = await func(*args, **kwargs)
                status = "success"
                return result
            except Exception:
                status = "error"
                raise
            finally:
                duration = time.time() - start_time
                REQUEST_DURATION.labels(method=method, endpoint=endpoint).observe(duration)
                REQUESTS_TOTAL.labels(method=method, endpoint=endpoint, status=status).inc()
        return wrapper
    return decorator

# Usage
@instrument_request(method="POST", endpoint="/api/v1/payments")
async def create_payment(request):
    """Create payment endpoint."""
    # ... implementation
    pass
Compliance Requirements
GDPR/Privacy
- MUST NOT log personally identifiable information (PII) without explicit consent
- MUST anonymize user identifiers in logs when possible
- MUST provide log redaction capabilities for sensitive data
- SHOULD implement log retention policies compliant with data protection regulations
Security
- MUST encrypt log data in transit and at rest
- MUST implement access controls for log data
- MUST audit all access to audit logs
- SHOULD implement tamper-evident logging for critical operations
Performance
- MUST NOT block application execution on log writes
- MUST use async logging for high-volume applications
- SHOULD sample high-volume logs to prevent overload
- SHOULD buffer logs locally before sending to aggregation service
Dependencies
External Dependencies
| Dependency | Version | Purpose | License |
|---|---|---|---|
| structlog | >=23.0.0 | Structured logging framework | MIT |
| opentelemetry-api | >=1.25.0 | Distributed tracing API | Apache-2.0 |
| opentelemetry-sdk | >=1.25.0 | Distributed tracing SDK | Apache-2.0 |
| prometheus-client | >=0.20.0 | Metrics collection and exposition | Apache-2.0 |
| python-json-logger | >=2.0.0 | JSON formatter for structlog | BSD-2-Clause |
| uvloop | >=0.19.0 | Async event loop for performance (optional) | MIT |
Internal Dependencies
| Component | Spec ID | Purpose |
|---|---|---|
| Configuration Manager | SPEC-001 | Logging configuration management |
| Service Discovery | SPEC-003 | Log aggregation service discovery |
| Authentication/Authorization | SPEC-004 | User context for audit logs |
| Monitoring Dashboard | SPEC-012 | Metrics visualization and alerting |
Environmental Assumptions
- Log Storage: Centralized log aggregation service (Loki, ELK, Datadog) available
- Metrics Storage: Prometheus-compatible metrics storage available
- Tracing Backend: OpenTelemetry-compatible tracing backend (Jaeger, Tempo) available
- Network: All components can reach logging/metrics/tracing endpoints
- Clock Synchronization: NTP-synchronized clocks for accurate timestamps
- Disk Space: Sufficient disk space for local log buffering (default: 1GB)
Migration Plan
Phase 1: Foundation (Current)
- Implement base exception hierarchy
- Configure structlog with JSON output
- Add basic metrics collection
- Update existing code to use new exception classes
Phase 2: Integration
- Add distributed tracing with OpenTelemetry
- Implement context propagation across components
- Add comprehensive metrics for all major operations
- Implement log aggregation to centralized service
Phase 3: Advanced Features
- Implement circuit breaker pattern for all external integrations
- Add graceful degradation for critical paths
- Implement advanced alerting based on SLOs
- Add business metrics and dashboards
Phase 4: Optimization
- Optimize logging performance for high-throughput scenarios
- Implement log sampling and filtering
- Add predictive alerting based on ML models
- Implement automated anomaly detection
References
- Structlog Documentation
- OpenTelemetry Python SDK
- Prometheus Client Library
- 12-Factor App: Logs
- Microservices Patterns: Observability
- Google SRE: Monitoring Distributed Systems
Definition of Done
Completion Criteria
The logging and exception handling implementation is considered DONE when all of the following criteria are met:
-
Code Implementation
- [ ] Exception hierarchy implemented as defined in spec
- [ ] Structured logging with structlog configured
- [ ] Distributed tracing with OpenTelemetry integrated
- [ ] Metrics collection with Prometheus implemented
- [ ] Error handling patterns (retry, circuit breaker, graceful degradation) implemented
- [ ] Configuration via environment variables
-
Testing
- [ ] Unit test coverage ≥90% for observability modules
- [ ] Integration tests with log aggregation service
- [ ] Performance tests meeting throughput/latency targets
- [ ] Error injection tests for resilience validation
- [ ] Security tests for log data protection
-
Documentation
- [ ] API documentation for logging configuration
- [ ] Developer guide for exception handling
- [ ] Operations guide for monitoring and alerting
- [ ] Troubleshooting guide for common issues
- [ ] Compliance documentation for audit purposes
-
Deployment
- [ ] Log aggregation service deployed and configured
- [ ] Metrics dashboard deployed with key metrics
- [ ] Alerting rules configured for critical errors
- [ ] Tracing backend deployed and integrated
- [ ] Backup/retention policies implemented
-
Quality Gates
- [ ] All tests passing in CI/CD pipeline
- [ ] Code review completed by at least 2 developers
- [ ] Security review completed
- [ ] Performance benchmarks meeting targets
- [ ] Documentation reviewed by technical writer
-
Operational Readiness
- [ ] Monitoring dashboards verified
- [ ] Alert notifications tested
- [ ] Log retention and rotation verified
- [ ] Disaster recovery procedures documented
- [ ] Rollback procedures tested
Acceptance Criteria Verification
| Criterion | Verification Method | Responsible Role |
|---|---|---|
| Exception hierarchy | Unit tests, code review | Developer |
| Structured logging | Log analysis, integration tests | QA Engineer |
| Distributed tracing | Trace visualization, integration tests | DevOps Engineer |
| Metrics collection | Dashboard verification, scraping tests | SRE |
| Error handling | Error injection tests, resilience tests | QA Engineer |
| Configuration | Environment variable tests, deployment tests | DevOps Engineer |
Exit Criteria
The specification is considered COMPLETE when:
- All Completion Criteria are met
- All Acceptance Criteria from User Scenarios are verified
- No critical bugs (P0/P1) remain open
- Performance targets are achieved
- Security review is passed
- Documentation is published
Revision History
| Version | Date | Author | Changes |
|---|---|---|---|
| 1.0.0 | 2026-04-09 | Mohamed | Initial specification |
Approval
| Role | Name | Date | Approval |
|---|---|---|---|
| Architect | Mohamed | 2026-04-09 | ✅ |
| QA Lead | |||
| Security | |||
| DevOps |