orchestrata_ultimate.postman.metrics
Reference › orchestrata_ultimate › postman › metrics
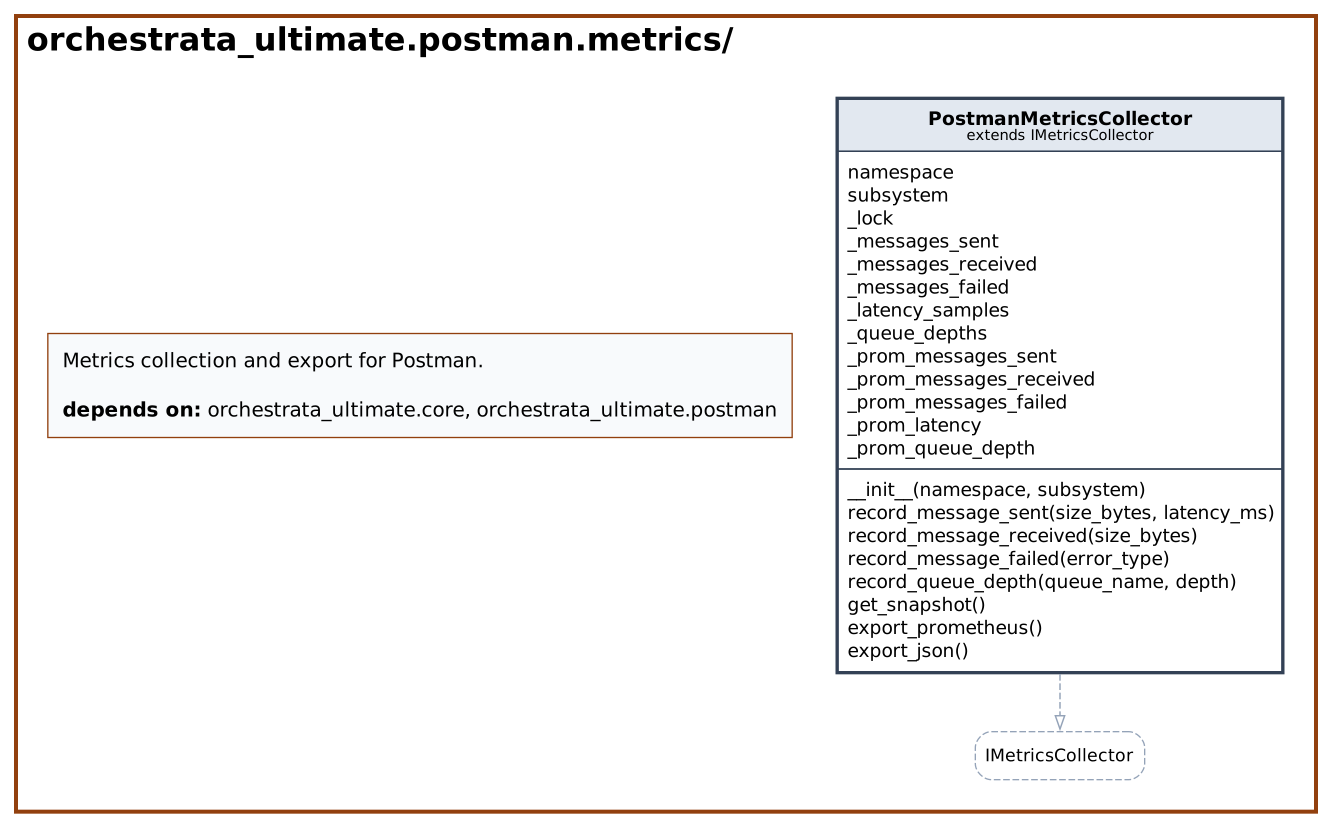
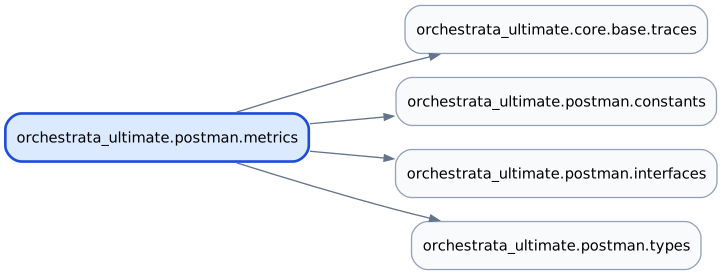
Broker metrics with a Prometheus export, SPEC-002 story US-008 (REQ-002-US-008-001, -002, -005, -006). PostmanMetricsCollector implements IMetricsCollector from interfaces and records message counts, latency and queue depths. It returns a MetricsSnapshot defined in types. Window and sample sizes come from constants. Nothing in the package imports it yet.
The constructor takes a metric namespace and subsystem (postman and broker by default) and creates internal counters plus Prometheus metrics named from them: sent, received and failed message counters, a latency summary in seconds, and a queue-depth gauge labelled by queue name. record_message_sent(size_bytes, latency_ms) increments the sent counter and keeps the latency in a bounded sample deque (1000 samples); record_message_received, record_message_failed(error_type) and record_queue_depth(queue_name, depth) record the others. Internal state is guarded by a re-entrant lock. get_snapshot builds a snapshot, export_prometheus returns the Prometheus text format and export_json a dictionary.
At a glance
| Source | src/orchestrata_ultimate/postman/metrics.py |
| Lines of code | 140 |
| Classes | 1 |
| Functions | 0 |
| Imports (internal) | orchestrata_ultimate.core.base.traces, orchestrata_ultimate.postman.constants, orchestrata_ultimate.postman.interfaces, orchestrata_ultimate.postman.types |
| Imported by | none |
| Tests that import it | tests/postman/test_metrics.py, tests/postman/test_monitoring.py, tests/postman/test_postman_interface_compliance.py, tests/postman/test_postman_signatures.py |
Class diagram
Dependency diagram
API
Classes
PostmanMetricsCollector
Bases: IMetricsCollector · Decorators: traces(spec='002', story='US-008', reqs=['REQ-002-US-008-001', 'REQ-002-US-008-002', 'REQ-002-US-008-005', 'REQ-002-US-… · Line 30
Metrics collector with Prometheus integration.
| Method | Signature | Summary |
|---|---|---|
__init__ |
__init__(namespace: str = 'postman', subsystem: str = 'broker') -> None |
|
record_message_sent |
record_message_sent(size_bytes: int, latency_ms: float) -> None |
|
record_message_received |
record_message_received(size_bytes: int) -> None |
|
record_message_failed |
record_message_failed(error_type: str) -> None |
|
record_queue_depth |
record_queue_depth(queue_name: str, depth: int) -> None |
|
get_snapshot |
get_snapshot() -> MetricsSnapshot |
|
export_prometheus |
export_prometheus() -> str |
|
export_json |
export_json() -> dict |
Source
"""Metrics collection and export for Postman.

Implements IMetricsCollector with counters, latency percentiles, and Prometheus export.
"""

import threading
from collections import deque

from prometheus_client import Counter, Gauge, Summary, generate_latest

from orchestrata_ultimate.core.base.traces import traces
from orchestrata_ultimate.postman.constants import METRICS_LATENCY_SAMPLE_MAXLEN
from orchestrata_ultimate.postman.interfaces import IMetricsCollector
from orchestrata_ultimate.postman.types import MetricsSnapshot


@traces(
    spec="002",
    story="US-008",
    reqs=[
        "REQ-002-US-008-001",
        "REQ-002-US-008-002",
        "REQ-002-US-008-005",
        "REQ-002-US-008-006",
        "REQ-002-US-008-013",
        "REQ-002-US-008-027",
        "REQ-002-US-008-028",
    ],
)
class PostmanMetricsCollector(IMetricsCollector):
    """Metrics collector with Prometheus integration."""

    def __init__(self, namespace: str = "postman", subsystem: str = "broker") -> None:
        self.namespace = namespace
        self.subsystem = subsystem
        self._lock = threading.RLock()

        # Internal counters
        self._messages_sent = 0
        self._messages_received = 0
        self._messages_failed = 0
        self._latency_samples: deque[float] = deque(
            maxlen=METRICS_LATENCY_SAMPLE_MAXLEN
        )
        self._queue_depths: dict[str, int] = {}

        # Prometheus metrics
        self._prom_messages_sent = Counter(
            f"{namespace}_{subsystem}_messages_sent_total", "Total messages sent"
        )
        self._prom_messages_received = Counter(
            f"{namespace}_{subsystem}_messages_received_total",
            "Total messages received",
        )
        self._prom_messages_failed = Counter(
            f"{namespace}_{subsystem}_messages_failed_total", "Total message failures"
        )
        self._prom_latency = Summary(
            f"{namespace}_{subsystem}_message_latency_seconds",
            "Message delivery latency",
        )
        self._prom_queue_depth = Gauge(
            f"{namespace}_{subsystem}_queue_depth",
            "Current queue depth",
            ["queue_name"],
        )

    @traces(
        spec="002",
        story="US-008",
        reqs=["REQ-002-US-008-001", "REQ-002-US-008-006"],
    )
    def record_message_sent(self, size_bytes: int, latency_ms: float) -> None:
        with self._lock:
            self._messages_sent += 1
            self._latency_samples.append(latency_ms)
        self._prom_messages_sent.inc()
        self._prom_latency.observe(latency_ms / 1000.0)

    @traces(spec="002", story="US-008", reqs=["REQ-002-US-008-002"])
    def record_message_received(self, size_bytes: int) -> None:
        with self._lock:
            self._messages_received += 1
        self._prom_messages_received.inc()

    @traces(spec="002", story="US-008", reqs=["REQ-002-US-008-005"])
    def record_message_failed(self, error_type: str) -> None:
        with self._lock:
            self._messages_failed += 1
        self._prom_messages_failed.inc()

    @traces(spec="002", story="US-008", reqs=["REQ-002-US-008-013"])
    def record_queue_depth(self, queue_name: str, depth: int) -> None:
        with self._lock:
            self._queue_depths[queue_name] = depth
        self._prom_queue_depth.labels(queue_name=queue_name).set(depth)

    @traces(
        spec="002",
        story="US-008",
        reqs=[
            "REQ-002-US-008-001",
            "REQ-002-US-008-002",
            "REQ-002-US-008-005",
            "REQ-002-US-008-006",
            "REQ-002-US-008-013",
        ],
    )
    def get_snapshot(self) -> MetricsSnapshot:
        with self._lock:
            # Calculate percentiles
            samples = list(self._latency_samples)
            if samples:
                sorted_samples = sorted(samples)
                n = len(sorted_samples)
                p95 = sorted_samples[int(n * 0.95)]
                p99 = sorted_samples[int(n * 0.99)]
                avg = sum(samples) / n
            else:
                p95 = p99 = avg = 0.0

            return MetricsSnapshot(
                messages_sent=self._messages_sent,
                messages_received=self._messages_received,
                messages_failed=self._messages_failed,
                avg_latency_ms=avg,
                p95_latency_ms=p95,
                p99_latency_ms=p99,
                queue_depths=dict(self._queue_depths),
                active_subscriptions=0,  # Not tracked in this simplified version
            )

    @traces(spec="002", story="US-008", reqs=["REQ-002-US-008-027"])
    def export_prometheus(self) -> str:
        return generate_latest().decode("utf-8")

    @traces(spec="002", story="US-008", reqs=["REQ-002-US-008-028"])
    def export_json(self) -> dict:
        snapshot = self.get_snapshot()
        return snapshot.to_dict()