orchestrata_ultimate.governance.monitoring
Reference › orchestrata_ultimate › governance › monitoring
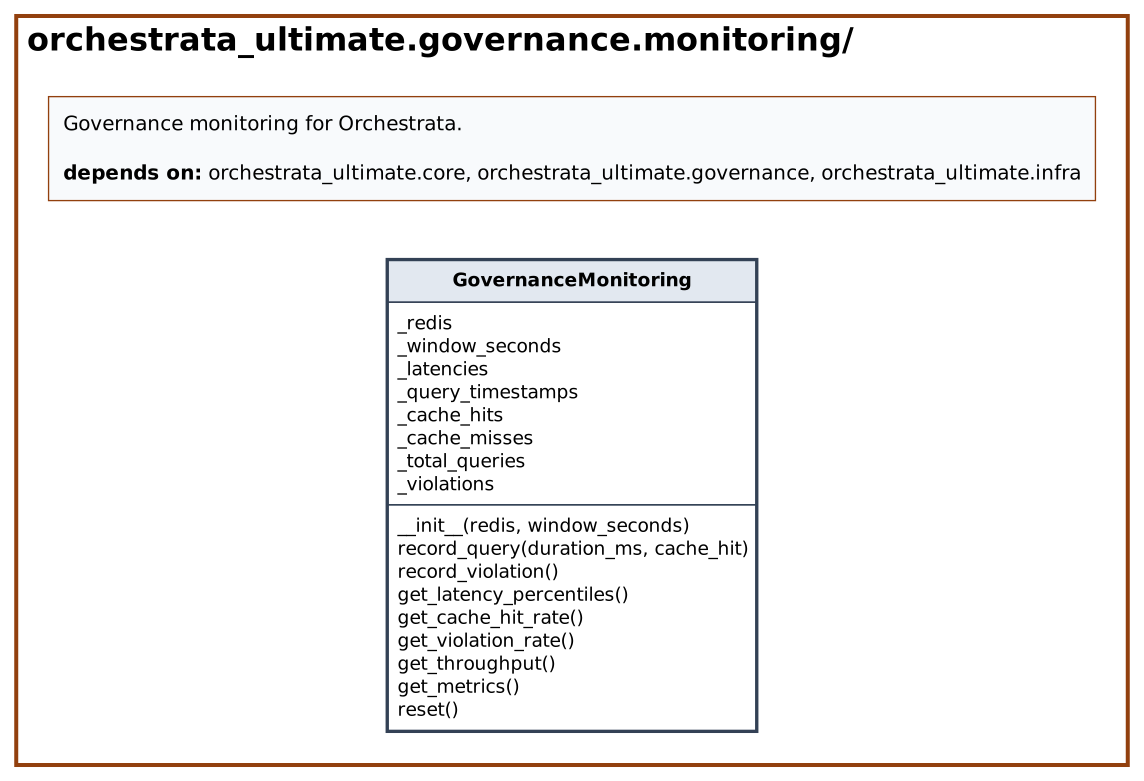
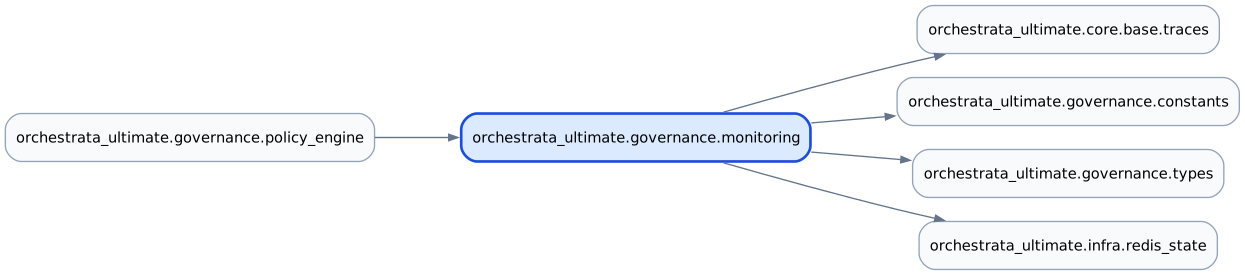
Runtime metrics for the governance engine, SPEC-007 (REQ-007-FR10-002, REQ-007-US-001-010, REQ-007-US-006-001, -003, -008). GovernanceMonitoring records how long governance queries take, how often the cache answered, and how many violations occurred. policy_engine is the importer; it calls record_query for each decision and record_violation for each denial. The result type is GovernanceMetrics from types.
record_query(duration_ms, cache_hit) keeps the latency and a timestamp in memory and counts cache hits and misses; if a Redis state manager was supplied it also increments Redis counters and pushes the latency to a list capped at 10000 entries, ignoring Redis errors. get_latency_percentiles returns p50, p95 and p99 of the stored latencies (zeros when empty), get_cache_hit_rate the hit share, get_violation_rate the violations per minute over the monitoring window, and get_throughput queries per second. get_metrics assembles a GovernanceMetrics and reset clears the state.
At a glance
| Source | src/orchestrata_ultimate/governance/monitoring.py |
| Lines of code | 213 |
| Classes | 1 |
| Functions | 0 |
| Imports (internal) | orchestrata_ultimate.core.base.traces, orchestrata_ultimate.governance.constants, orchestrata_ultimate.governance.types, orchestrata_ultimate.infra.redis_state |
| Imported by | orchestrata_ultimate.governance.policy_engine |
| Tests that import it | tests/generated_recovery/test_governance_monitoring.py, tests/governance/test_error_paths.py, tests/governance/test_monitoring.py, tests/governance/test_policy_engine.py, tests/governance/test_policy_engine_extended.py, tests/test_governance.py |
Class diagram
Dependency diagram
API
Classes
GovernanceMonitoring
Decorators: traces(spec='007', story='US-PGOV-006', reqs=['REQ-007-US-006-001', 'REQ-007-US-006-002', 'REQ-007-US-006-003', 'REQ-00… · Line 42
Monitors governance system performance.
| Method | Signature | Summary |
|---|---|---|
__init__ |
__init__(redis: RedisStateManager | None = None, window_seconds: int = MONITORING_WINDOW_SECONDS) -> None |
|
record_query |
record_query(duration_ms: float, cache_hit: bool = False) -> None |
Record a governance query execution. |
record_violation |
record_violation() -> None |
Record a governance violation for metrics. |
get_latency_percentiles |
get_latency_percentiles() -> dict[str, float] |
Get latency percentiles (p50, p95, p99). |
get_cache_hit_rate |
get_cache_hit_rate() -> float |
Get cache hit rate as percentage. |
get_violation_rate |
get_violation_rate() -> float |
Get violation rate (per minute) within the monitoring window. |
get_throughput |
get_throughput() -> float |
Get current throughput (queries per second). |
get_metrics |
get_metrics() -> GovernanceMetrics |
Get a full metrics snapshot. |
reset |
reset() -> None |
Reset all metrics. |
Source
# mypy: ignore-errors
"""Governance monitoring for Orchestrata.

Tracks query latency, cache hit rates, violation rates,
and throughput metrics.
"""

from __future__ import annotations

import logging
import statistics
import time
from collections import deque
from typing import TYPE_CHECKING

if TYPE_CHECKING:
    from orchestrata_ultimate.infra.redis_state import RedisStateManager

from orchestrata_ultimate.core.base.traces import traces
from orchestrata_ultimate.governance.constants import (
    MONITORING_LATENCY_DEQUE_MAXLEN,
    MONITORING_REDIS_PREFIX,
    MONITORING_WINDOW_SECONDS,
)
from orchestrata_ultimate.governance.types import GovernanceMetrics

_logger = logging.getLogger(__name__)


@traces(
    spec="007",
    story="US-PGOV-006",
    reqs=[
        "REQ-007-US-006-001",
        "REQ-007-US-006-002",
        "REQ-007-US-006-003",
        "REQ-007-US-006-008",
        "REQ-007-US-006-009",
        "REQ-007-US-006-010",
    ],
)
class GovernanceMonitoring:
    """Monitors governance system performance.

    Tracks latency, throughput, cache hit rates, and violation rates.
    Stores metrics in Redis for cross-process visibility.
    """

    @traces(
        spec="007",
        story="US-PGOV-006",
        reqs=["REQ-007-US-006-008", "REQ-007-US-006-009"],
    )
    def __init__(
        self,
        redis: RedisStateManager | None = None,
        window_seconds: int = MONITORING_WINDOW_SECONDS,
    ) -> None:
        self._redis = redis
        self._window_seconds = window_seconds
        self._latencies: deque = deque(maxlen=MONITORING_LATENCY_DEQUE_MAXLEN)
        self._query_timestamps: deque = deque(maxlen=MONITORING_LATENCY_DEQUE_MAXLEN)
        self._cache_hits = 0
        self._cache_misses = 0
        self._total_queries = 0
        self._violations = 0

    @traces(
        spec="007",
        story="US-PGOV-001",
        reqs=[
            "REQ-007-FR10-002",
            "REQ-007-US-001-010",
            "REQ-007-US-006-008",
        ],
    )
    def record_query(self, duration_ms: float, cache_hit: bool = False) -> None:
        """Record a governance query execution."""
        now = time.time()
        self._latencies.append(duration_ms)
        self._query_timestamps.append(now)
        self._total_queries += 1
        if cache_hit:
            self._cache_hits += 1
        else:
            self._cache_misses += 1

        # Push to Redis if available
        if self._redis is not None:
            try:
                pipe = self._redis.client.pipeline()
                pipe.incr(f"{MONITORING_REDIS_PREFIX}:total_queries")
                pipe.lpush(f"{MONITORING_REDIS_PREFIX}:latencies", str(duration_ms))
                pipe.ltrim(f"{MONITORING_REDIS_PREFIX}:latencies", 0, 9999)
                if cache_hit:
                    pipe.incr(f"{MONITORING_REDIS_PREFIX}:cache_hits")
                else:
                    pipe.incr(f"{MONITORING_REDIS_PREFIX}:cache_misses")
                pipe.execute()
            except Exception as exc:
                _logger.debug("Redis metrics push failed: %s", exc)

    @traces(
        spec="007",
        story="US-PGOV-006",
        reqs=[
            "REQ-007-FR10-002",
            "REQ-007-FR7-002",
            "REQ-007-US-006-010",
        ],
    )
    def record_violation(self) -> None:
        """Record a governance violation for metrics."""
        self._violations += 1
        if self._redis is not None:
            try:
                self._redis.client.incr(f"{MONITORING_REDIS_PREFIX}:violations")
            except Exception as exc:
                _logger.warning(
                    "Redis violation counter increment failed: %s", exc, exc_info=True
                )

    @traces(
        spec="007",
        story="US-PGOV-006",
        reqs=["REQ-007-US-006-001"],
    )
    def get_latency_percentiles(self) -> dict[str, float]:
        """Get latency percentiles (p50, p95, p99)."""
        if not self._latencies:
            return {"p50": 0.0, "p95": 0.0, "p99": 0.0}
        sorted_latencies = sorted(self._latencies)
        n = len(sorted_latencies)
        return {
            "p50": sorted_latencies[int(n * 0.50)] if n > 0 else 0.0,
            "p95": sorted_latencies[min(int(n * 0.95), n - 1)] if n > 0 else 0.0,
            "p99": sorted_latencies[min(int(n * 0.99), n - 1)] if n > 0 else 0.0,
        }

    @traces(
        spec="007",
        story="US-PGOV-006",
        reqs=["REQ-007-US-006-002"],
    )
    def get_cache_hit_rate(self) -> float:
        """Get cache hit rate as percentage."""
        total = self._cache_hits + self._cache_misses
        if total == 0:
            return 0.0
        return (self._cache_hits / total) * 100.0

    @traces(spec="007", story="US-PGOV-006", reqs=["REQ-007-US-006-003"])
    def get_violation_rate(self) -> float:
        """Get violation rate (per minute) within the monitoring window."""
        if self._violations == 0:
            return 0.0
        # Use the window duration for rate calculation
        now = time.time()
        recent_queries = [
            ts for ts in self._query_timestamps if now - ts <= self._window_seconds
        ]
        if not recent_queries:
            return 0.0
        window_duration = now - min(recent_queries)
        if window_duration <= 0:
            return 0.0
        return self._violations * (60.0 / max(window_duration, 1.0))

    @traces(
        spec="007",
        story="FR-PGOV-010",
        reqs=["REQ-007-FR10-122"],
    )
    def get_throughput(self) -> float:
        """Get current throughput (queries per second)."""
        now = time.time()
        recent = [
            ts for ts in self._query_timestamps if now - ts <= self._window_seconds
        ]
        if len(recent) < 2:
            return 0.0
        window = now - min(recent)
        if window <= 0:
            return 0.0
        return len(recent) / window

    @traces(
        spec="007",
        story="US-PGOV-006",
        reqs=["REQ-007-US-006-001", "REQ-007-US-006-002", "REQ-007-US-006-003"],
    )
    def get_metrics(self) -> GovernanceMetrics:
        """Get a full metrics snapshot."""
        percentiles = self.get_latency_percentiles()
        avg_latency = statistics.mean(self._latencies) if self._latencies else 0.0
        return GovernanceMetrics(
            total_queries=self._total_queries,
            cache_hit_rate=self.get_cache_hit_rate(),
            avg_latency_ms=avg_latency,
            p95_latency_ms=percentiles["p95"],
            p99_latency_ms=percentiles["p99"],
            violation_rate=self.get_violation_rate(),
            throughput_qps=self.get_throughput(),
        )

    def reset(self) -> None:
        """Reset all metrics."""
        self._latencies.clear()
        self._query_timestamps.clear()
        self._cache_hits = 0
        self._cache_misses = 0
        self._total_queries = 0
        self._violations = 0